


ADANI ENT
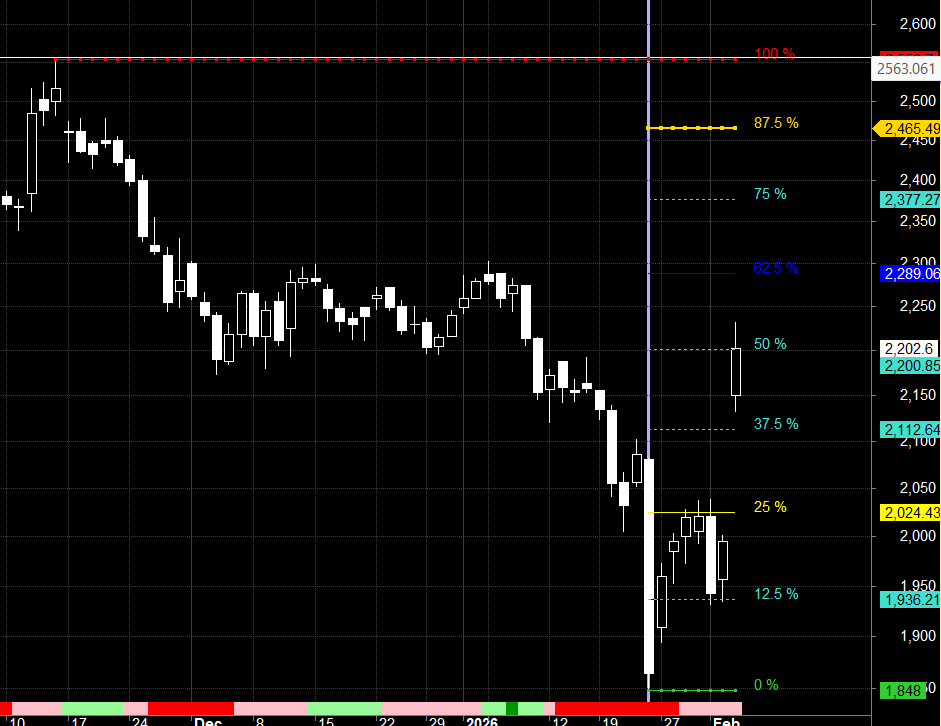
Positional Outlook: The stock showed a reversal pattern after closing above Octave Point 2200
- Bullish Scenario: If the price gives a confirmed close above 2200, it triggers a fresh breakout, potentially opening room for an upside rally towards 2289 and 2377 .
Intraday Key Levels: The price is currently consolidating. Watch these pivot points for direction:
-
Strength (Upside): A sustained move above 2200 indicates bullish momentum. If this holds, the next resistance levels to watch are 2222, 2244 and 2266.
-
Support/Invalidation: This setup technically weakens if the price drops back below 2182.
-
-
Weakness (Downside): Selling pressure typically intensifies below 2166. A breakdown here could see the price test lower supports at 2144, 2121 or 2100.
-
Resistance/Invalidation: This negative view is negated if the price reclaims 2182.
-
CAMS
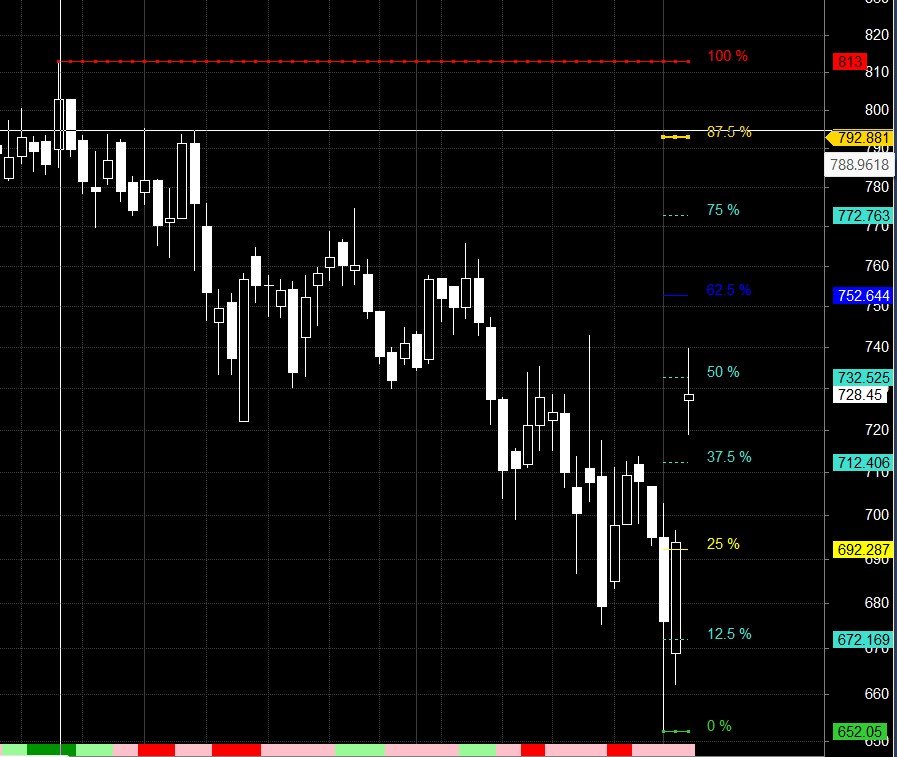
Positional Outlook: The stock is approaching a key resistance level at 733.
- Bullish Scenario: If the price gives a confirmed close below 733, it triggers a fresh breakout, potentially opening room for an upside rally towards 752 and 772.
Intraday Key Levels: The price is currently consolidating. Watch these pivot points for direction:
-
Strength (Upside): A sustained move above 733 indicates bullish momentum. If this holds, the next resistance levels to watch are 740, 747 and 754.
-
Support/Invalidation: This setup technically weakens if the price drops back below 729.
-
-
Weakness (Downside): Selling pressure typically intensifies below 725 . A breakdown here could see the price test lower supports at 717, 710 or 700.
-
Resistance/Invalidation: This negative view is negated if the price reclaims 729.
-
Bajaj Finance
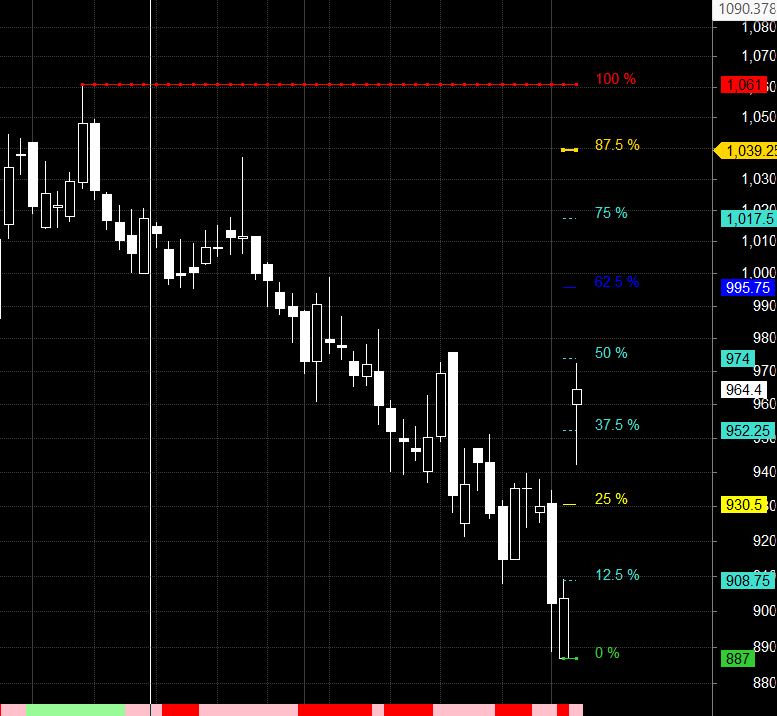
Positional Technical View: The stock is currently testing a critical Resistance zone. On a closing basis, 974acts as a major make-or-break level.
- Bullish Scenario: If the price gives a confirmed close above 974 , it triggers a fresh breakout, potentially opening room for an upside rally towards 995/1017
Intraday Key Levels: The price is currently consolidating. Watch these pivot points for direction:
-
Strength (Upside): A sustained move above 974 indicates bullish momentum. If this holds, the next resistance levels to watch are 982, 990 and 1000.
-
Support/Invalidation: This setup technically weakens if the price drops back below 966.
-
-
Weakness (Downside): Selling pressure typically intensifies below 960 . A breakdown here could see the price test lower supports at 952, 941 or 927.
-
Resistance/Invalidation: This negative view is negated if the price reclaims 966.
-
I am not a SEBI registered Research Analyst or Investment Advisor. The levels and analysis shared here are strictly for educational purposes only and should not be construed as buy or sell recommendations. Please consult a certified financial advisor before making any trading decisions. I am not responsible for your profit or loss.
WE do not haev any kind of advisory services. We do not have any Telegram or Whatsapp Channel. Views Shared Here are our Online Trading Journal.
Please be aware that investing in financial markets involves inherent risks, and past performance is not indicative of future results. We, the authors and contributors, shall not be held responsible for any financial outcomes, including but not limited to profit or loss, arising from the use of the information on this website.
It is strongly recommended that you seek the advice of a qualified investment professional or a SEBI Registered Advisor before making any investment decisions. Your financial situation, risk tolerance, and investment goals should be carefully considered before implementing any strategies discussed on this platform.
Additionally, we may not be aware of your specific financial circumstances, and our content should not be considered a substitute for personalized advice. Always conduct thorough research and consult with your own investment advisor to ensure that any investment decisions align with your individual financial objectives.
By accessing and using the information provided on this website, you acknowledge and agree that you are solely responsible for your investment decisions. We disclaim any liability for any direct or indirect damages, including financial losses, that may result from the use of or reliance on the information presented here.
How to trade Intraday and Positional Stocks Analysis — Click on this link
As always I wish you maximum health and trading success
-
All prices relate to the NSE Spot/Cash Market
-
Calls are based on the previous trading day’s price activity.
-
Intraday call is valid for the next trading session only unless otherwise mentioned.
-
Stop-loss levels are given so that there is a level below/above, which the market will tell us that the call has gone wrong. Stop-loss is an essential risk control mechanism; it should always be there.
-
Book, at least, part profits when the prices reach their targets; if you continue to hold on to positions then use trailing stops to lock in your profits.