


Disclaimer
This analysis represents the highest-probability forecast derived from expert, multi-decade historical evaluation of astrological signatures and their documented correlation with market psychology and price action.
No Guarantee
This is not a guarantee of future market performance. Financial markets are influenced by numerous dynamic and unpredictable real-world factors. All trading and investment activities carry significant risk, including the potential loss of principal.
Educational Purpose Only
This content is strictly for informational and educational purposes and should not be construed as financial advice or a recommendation to buy, sell, or trade any financial instrument.
Consult a Professional
We strongly advise you to consult a qualified financial advisor before making any investment decisions. Any actions you take based on this analysis are solely your responsibility. We assume no liability for any financial profits or losses that may occur.
Theme for Sensex: The Gann Time Pivot into The Capitulation Reversal
The theme for the Sensex is a classic breakdown at a key time pivot, leading to a capitulation low and a subsequent, violent short-covering rally. The Rahu SR sets a tone of deception and false moves at the start of the week. The true technical test comes as the market is pressured into its key Gann Square pivot date on Thursday. The market is designed to break down before this date, with the final flush-out occurring during Wednesday’s Mercury-Jupiter chaos. This is the shakeout. The reversal begins with the innovative Venus-Uranus trine on Thursday, perfectly timed with the Gann date, to ignite a powerful V-shaped recovery. This recovery is validated and given momentum by the powerful Bayer Rule 9 trend change signal on Friday.
For a Detailed Day by Day Forecast with Neural Analysis Please watch the below video
SENSEX Harmonic Pattern
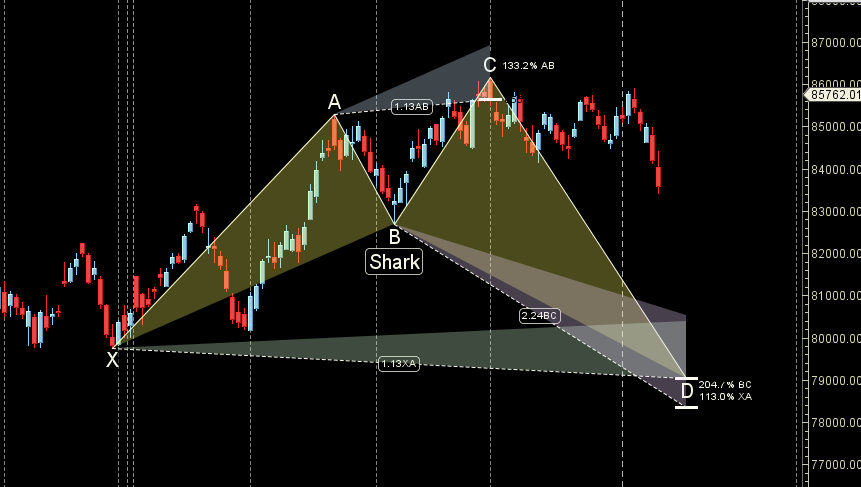
Sensex Shark pattern worked perfectly heading towards 83000/82729
SENSEX Gann Angles
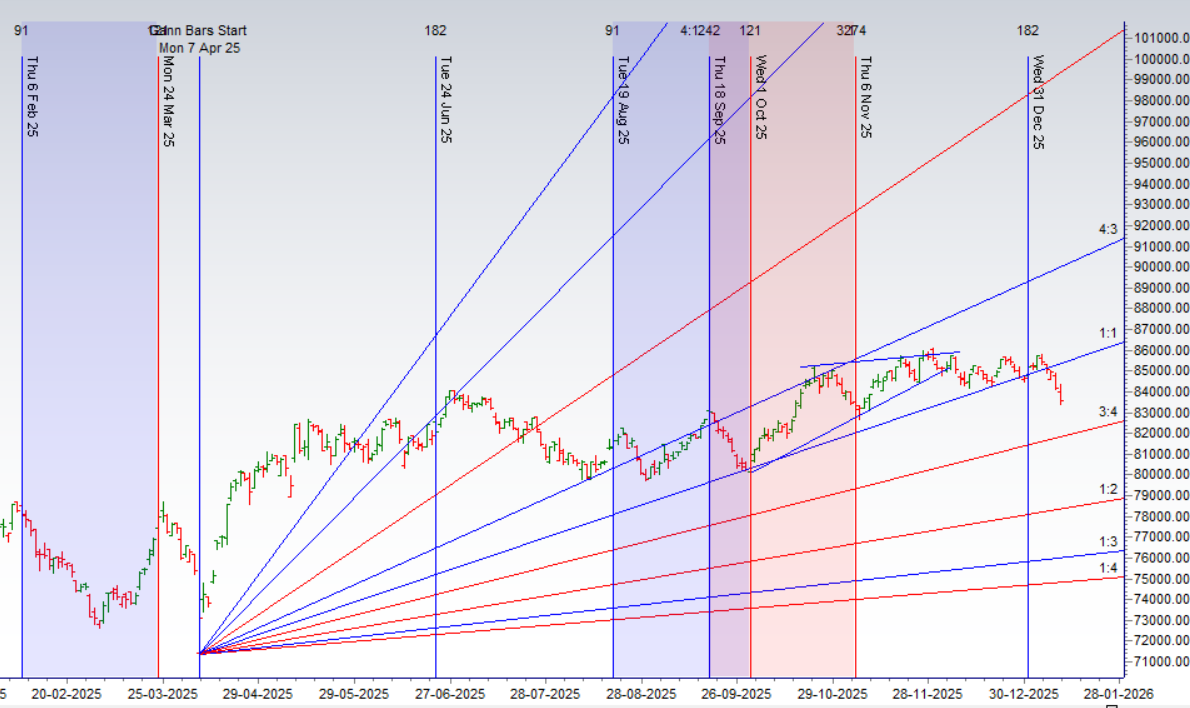
Sensex broke its 1×1 gann angle heading towards 83000/82500
SENSEX Supply and Demand
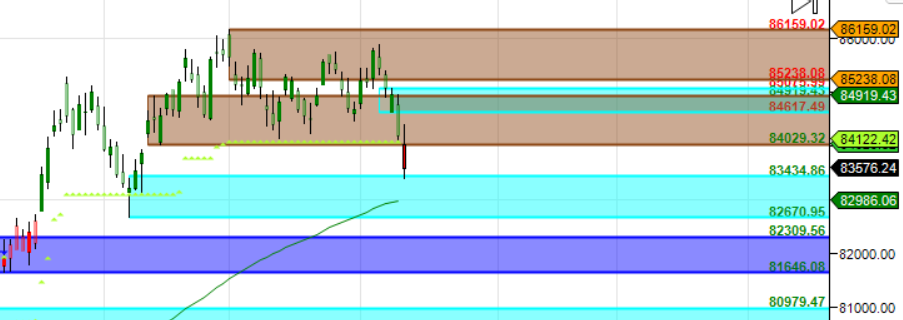
Self Explanatory Chart
SENSEX Time Analysis Pressure Dates
Key Pivot Dates: Watch 14 Jan
SENSEX Weekly Chart
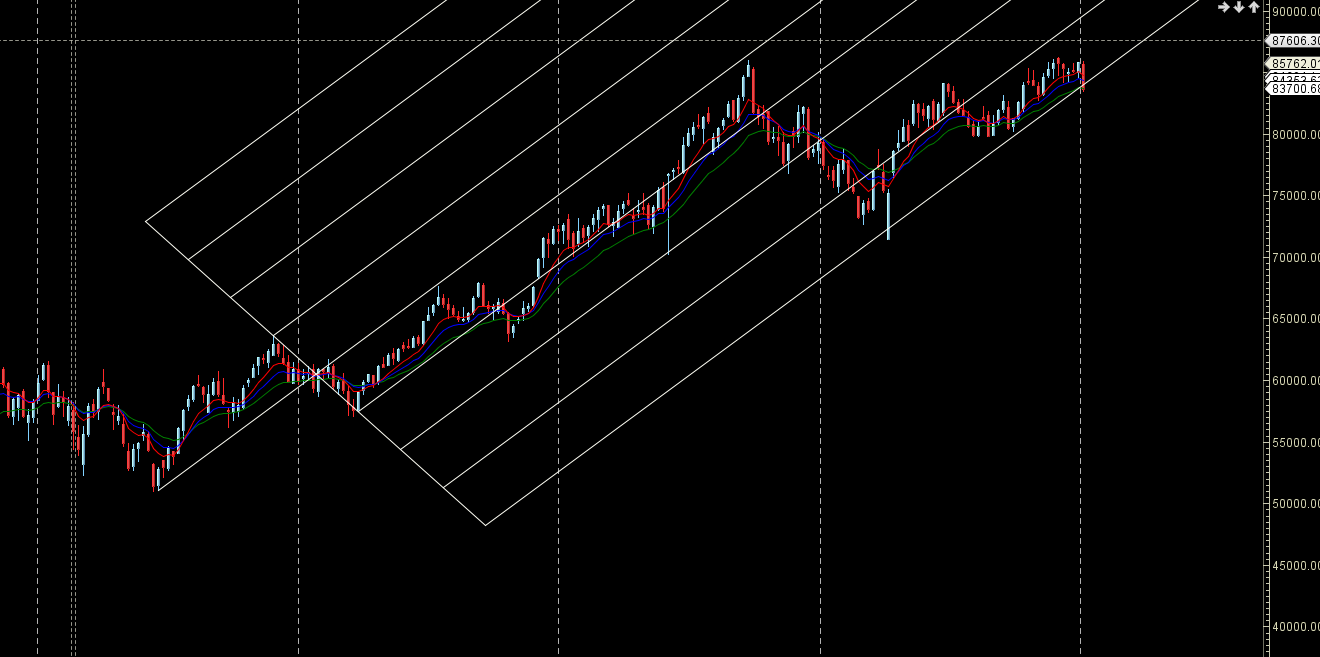
Price is back to its Weekly AF support zone
SENSEX Monthly Charts
84194 is Monthly resistance zone 83167 is Support zone.
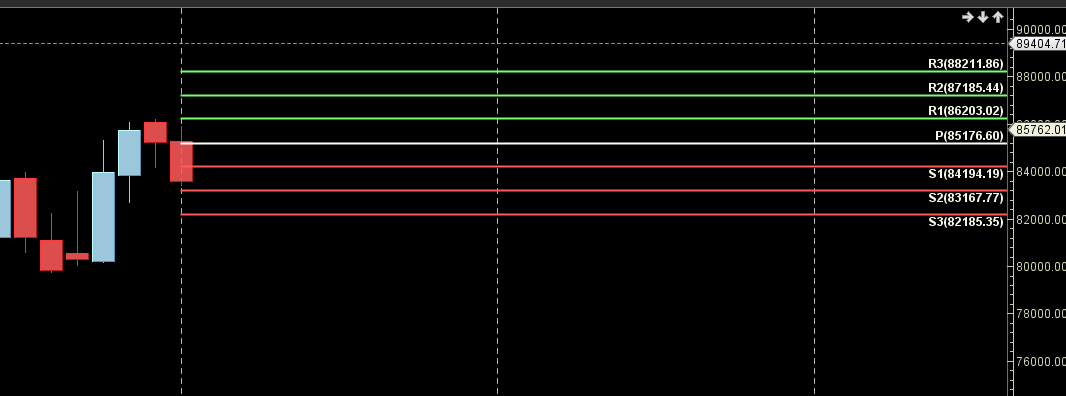
SENSEX Weekly Levels
SENSEX Trend Deciding Level: 83617
SENSEX Resistance: 83909,84201,84492,84784
SENSEX Support: 83325,83034,82742,82555
Levels mentioned are SENSEX Spot
Learn More:
W.D. Gann Trading Strategies – Learn how to decode markets using price, time, and geometry.
Trading Using Financial Astrology – Discover how planetary motion impacts market behavior and how to trade it effectively.
Ready to Trade Like a Time-Master?
Join our one-on-one mentorship to master astro-timing, Gann analysis, and institutional-grade setups.
Call: 09985711341
Email: bhandaribrahmesh@gmail.com
very nice Sir