


Disclaimer : This analysis represents the highest-probability forecast derived from expert, multi-decade historical evaluation of astrological signatures and their documented correlation with market psychology and price action.
No Guarantee: This is not a guarantee of future market performance. Financial markets are influenced by numerous dynamic and unpredictable real-world factors. All trading and investment activities carry significant risk, including the potential loss of principal.
Educational Purpose Only :This content is strictly for informational and educational purposes and should not be construed as financial advice or a recommendation to buy, sell, or trade any financial instrument.
Consult a Professional :We strongly advise you to consult a qualified financial advisor before making any investment decisions. Any actions you take based on this analysis are solely your responsibility. We assume no liability for any financial profits or losses that may occur.
Theme for Gold : The Risk-Off Bid into The Innovation Pivot
The theme for Gold is a “Risk-Off Bid into an Innovation Pivot.” The first act of the week is bullish. The uncertainty of the Rahu SR and the building pressure from the maturing Gann cycles in the indices will trigger a classic flight-to-safety bid into precious metals. This will be a solid, fear-driven rally. This rally will peak mid-week at the point of maximum fear during the Mercury-Jupiter opposition on Wednesday. The second act brings a crucial divergence. As the market pivots to “risk-on” on Thursday, driven by the innovative Venus-Uranus trine, Silver’s rally will stall and fade. However, Silver, with its strong industrial and technological applications, is perfectly aligned with this innovative energy and is likely to find a powerful new bid, allowing it to outperform Gold significantly into the end of the week.
For a Detailed Day by Day Forecast with Neural Analysis Please watch the below video
MCX GOLD Gann Angle Chart
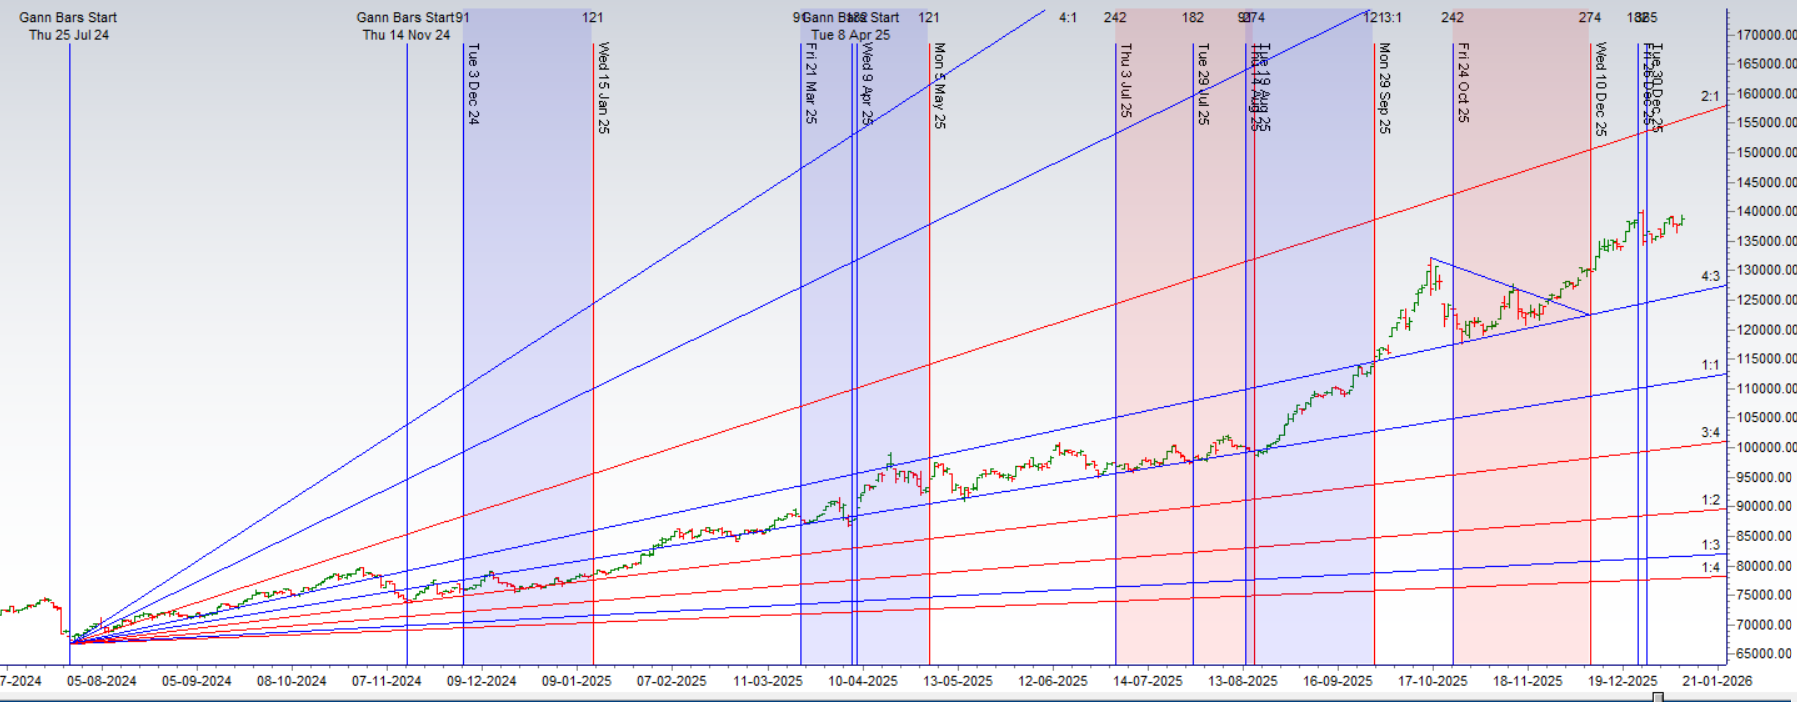
Gold again heading for a breakout above 139k
MCX GOLD Supply Demand Zone
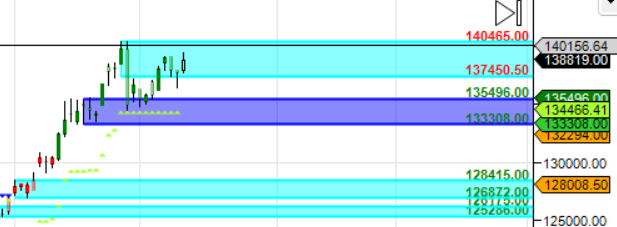
MCX GOLD Supply Demand Chart : Demand in range of 137450-137500 K , Supply in range of 135469-135500
MCX GOLD Harmonic Analysis
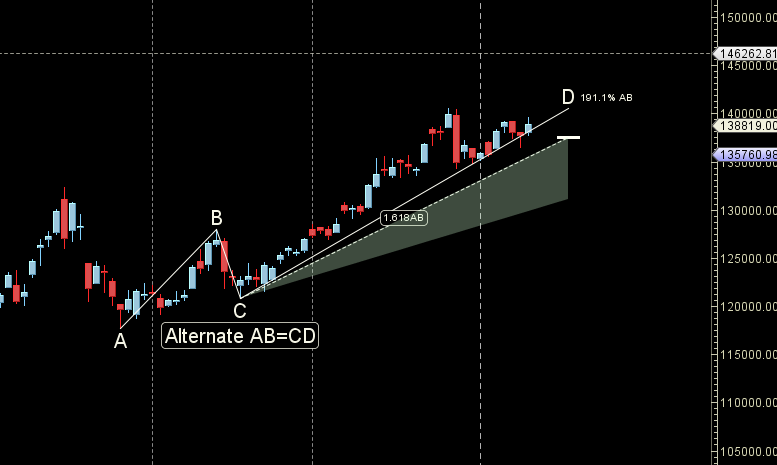
Heading towards the final target of 139-140 K
MCX GOLD Weekly
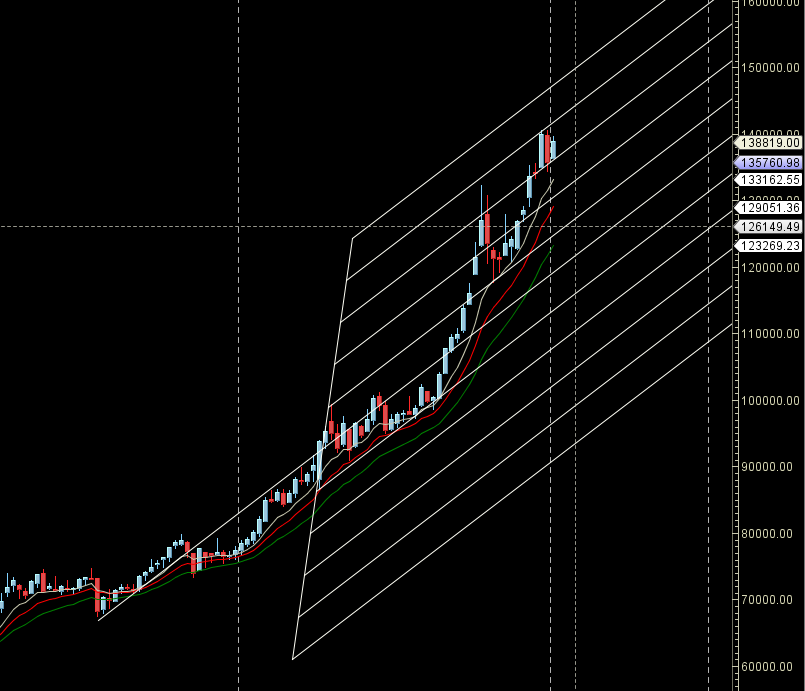
Gold reacted from Weekly AF Support zone
MCX GOLD Monthly
140 K Monthly Resistance and 134261 Monthly Support.
GOLD Astro/Gann Trend Change Date
Key Pivot Dates: Watch 14 Jan
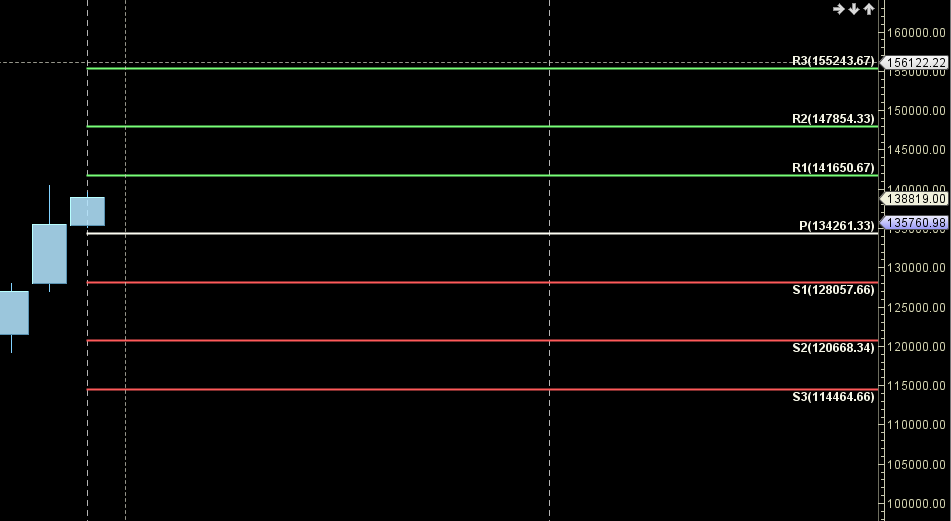
GOLD Weekly Levels
Weekly Trend Change Level:138734
Weekly Resistance: 139480, 140228, 140977, 141729, 142483
Weekly Support: 138729, 137990, 137248, 135770, 135034
Levels Mentioned are for Current Month Future
Learn More:
W.D. Gann Trading Strategies – Learn how to decode markets using price, time, and geometry.
Trading Using Financial Astrology – Discover how planetary motion impacts market behavior and how to trade it effectively.
Ready to Trade Like a Time-Master?
Join our one-on-one mentorship to master astro-timing, Gann analysis, and institutional-grade setups.