


PB FINTECH
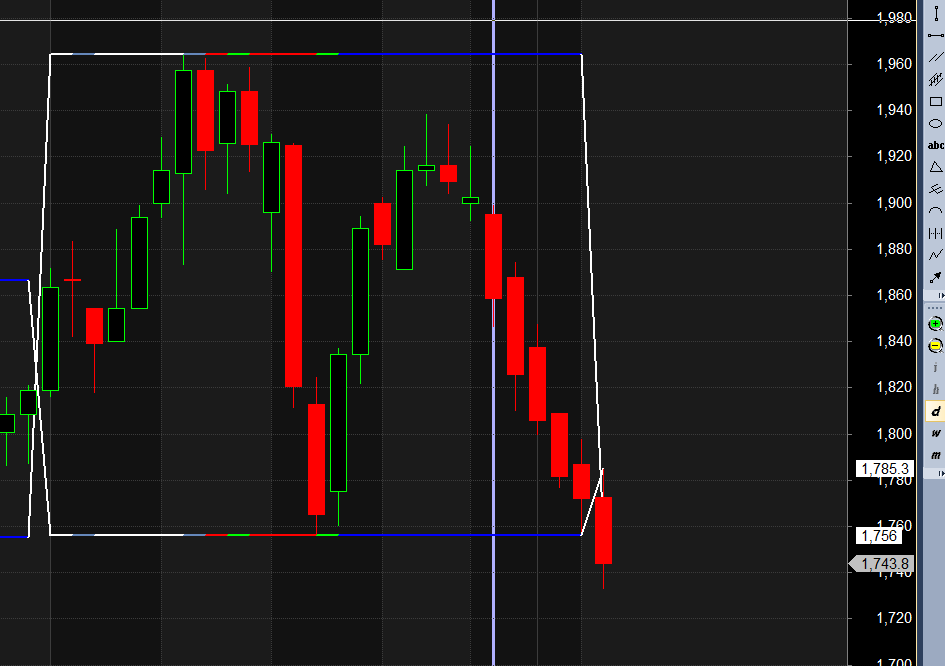
Positional View: The stock is facing a major support at 1729 .
- Bearish Scenario: If the price gives a confirmed close below 1756 , the chart structure strenght , potentially opening room towards the 1810 supply zone.
Intraday Scenarios: For today’s session, the price action revolves around the breakout or breakdown of the current consolidation range.
-
Strength (Upside): A sustained move above 1756 indicates fresh buying interest. In this case, the immediate resistance levels are 1777, 1790 and 1810.
-
Support/Invalidation: This positive structure technically weakens if the price fails to hold 1743.
-
-
Weakness (Downside): Selling pressure may intensify if the price slips below 1740. The next support zones to watch would be 1729, 1717 and 1700.
-
Resistance/Invalidation: This bearish view is negated if the price reverses and reclaims 1750.
-
JSW ENERGY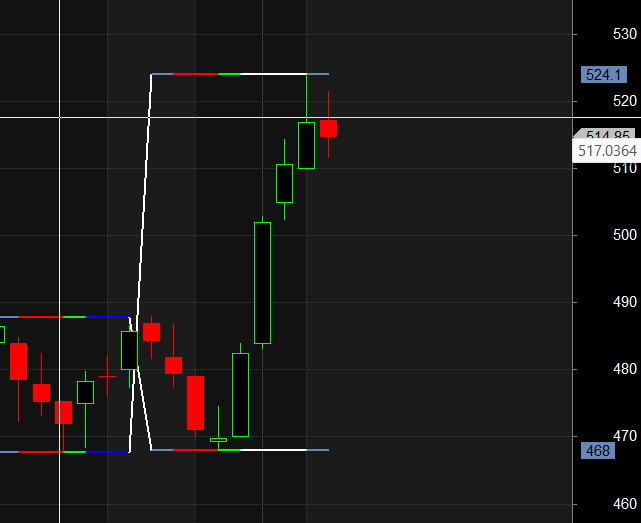
Positional Outlook: The stock is approaching a key resistance level at 525.
- Bearish Scenario: If the price gives a confirmed close below 515 , the chart structure weakens, potentially opening room towards the 500 demand zone.
Intraday Key Levels: The price is currently consolidating. Watch these pivot points for direction:
-
Strength (Upside): A sustained move above 520 indicates bullish momentum. If this holds, the next resistance levels to watch are 525, 530 and 535.
-
Support/Invalidation: This setup technically weakens if the price drops back below 516.
-
-
Weakness (Downside): Selling pressure typically intensifies below 515 . A breakdown here could see the price test lower supports at 510,500 or 495.
-
Resistance/Invalidation: This negative view is negated if the price reclaims 520.
-
SBIN
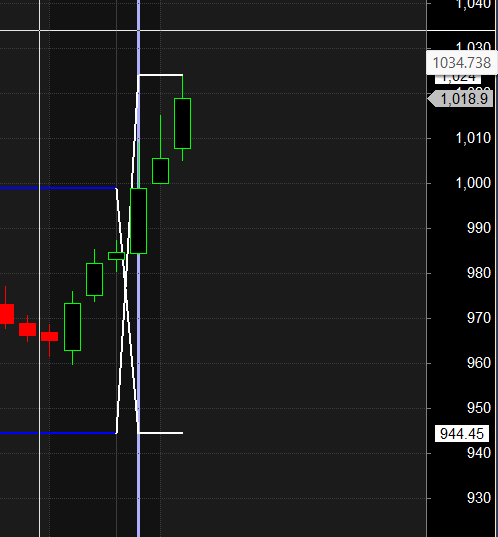
Positional Technical View: The stock is currently testing a critical Resistance zone. On a closing basis, 1025 acts as a major make-or-break level.
-
Bearish Scenario: If the price gives a confirmed close below 1008 , the chart structure weakens, potentially opening room towards the 980 demand zone.
Intraday Key Levels to Watch: For today’s session, the price action is poised between immediate resistance and support.
-
Strength (Upside): Momentum is likely to pick up if the price sustains above 1025 . In this scenario, the next resistance levels to watch are 1035, 1045 and 1055 .
-
Invalidation Level: This bullish view weakens if the price dips back below 1018.
-
-
Weakness (Downside): Immediate pressure is visible below 1008. A breakdown here could see the price drift towards 1000, 990 or 980.
-
Invalidation Level: This bearish setup typically negates if the price reclaims 1015.
-
I am not a SEBI registered Research Analyst or Investment Advisor. The levels and analysis shared here are strictly for educational purposes only and should not be construed as buy or sell recommendations. Please consult a certified financial advisor before making any trading decisions. I am not responsible for your profit or loss.
WE do not haev any kind of advisory services. We do not have any Telegram or Whatsapp Channel. Views Shared Here are our Online Trading Journal.
Please be aware that investing in financial markets involves inherent risks, and past performance is not indicative of future results. We, the authors and contributors, shall not be held responsible for any financial outcomes, including but not limited to profit or loss, arising from the use of the information on this website.
It is strongly recommended that you seek the advice of a qualified investment professional or a SEBI Registered Advisor before making any investment decisions. Your financial situation, risk tolerance, and investment goals should be carefully considered before implementing any strategies discussed on this platform.
Additionally, we may not be aware of your specific financial circumstances, and our content should not be considered a substitute for personalized advice. Always conduct thorough research and consult with your own investment advisor to ensure that any investment decisions align with your individual financial objectives.
By accessing and using the information provided on this website, you acknowledge and agree that you are solely responsible for your investment decisions. We disclaim any liability for any direct or indirect damages, including financial losses, that may result from the use of or reliance on the information presented here.
How to trade Intraday and Positional Stocks Analysis — Click on this link
As always I wish you maximum health and trading success
-
All prices relate to the NSE Spot/Cash Market
-
Calls are based on the previous trading day’s price activity.
-
Intraday call is valid for the next trading session only unless otherwise mentioned.
-
Stop-loss levels are given so that there is a level below/above, which the market will tell us that the call has gone wrong. Stop-loss is an essential risk control mechanism; it should always be there.
-
Book, at least, part profits when the prices reach their targets; if you continue to hold on to positions then use trailing stops to lock in your profits.