


Disclaimer
This analysis represents the highest-probability forecast derived from expert, multi-decade historical evaluation of astrological signatures and their documented correlation with market psychology and price action.
No Guarantee
This is not a guarantee of future market performance. Financial markets are influenced by numerous dynamic and unpredictable real-world factors. All trading and investment activities carry significant risk, including the potential loss of principal.
Educational Purpose Only
This content is strictly for informational and educational purposes and should not be construed as financial advice or a recommendation to buy, sell, or trade any financial instrument.
Consult a Professional
We strongly advise you to consult a qualified financial advisor before making any investment decisions. Any actions you take based on this analysis are solely your responsibility. We assume no liability for any financial profits or losses that may occur.
Theme for Sensex: The Shakeout Bottom into The Parabolic Trap
The theme for the Sensex is a classic shakeout designed to set up a climactic blow-off top. The Venezuela news and Full Moon panic are the catalysts for a final, aggressive plunge on Monday, driving the index down to the waiting arms of the powerful Bayer Rule 6 bottoming signal. This event is designed to create a major swing low. From this low, the theme becomes a ferocious, liquidity-fueled rally. The mid-week Venus and Mars conjunctions will power a short-squeeze driven “melt-up” that is designed to look unstoppable and create maximum FOMO. This entire structure, however, is a parabolic trap. Bayer Rule 19 explicitly warns that this setup leads to a top. Friday’s Venus-Jupiter opposition is the trigger that springs the trap, sparking a sharp and painful reversal from the highs.
For a Detailed Day by Day Forecast with Neural Analysis Please watch the below video
SENSEX Harmonic Pattern
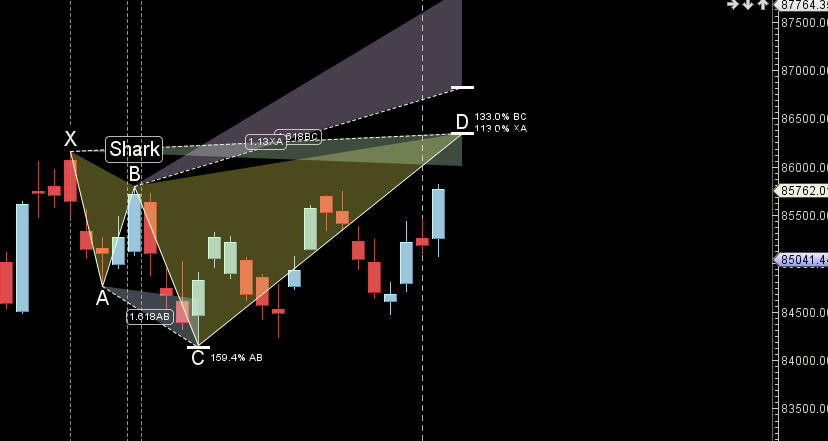
Sensex is heading towards its PRZ zone of 86-86200
SENSEX Gann Angles
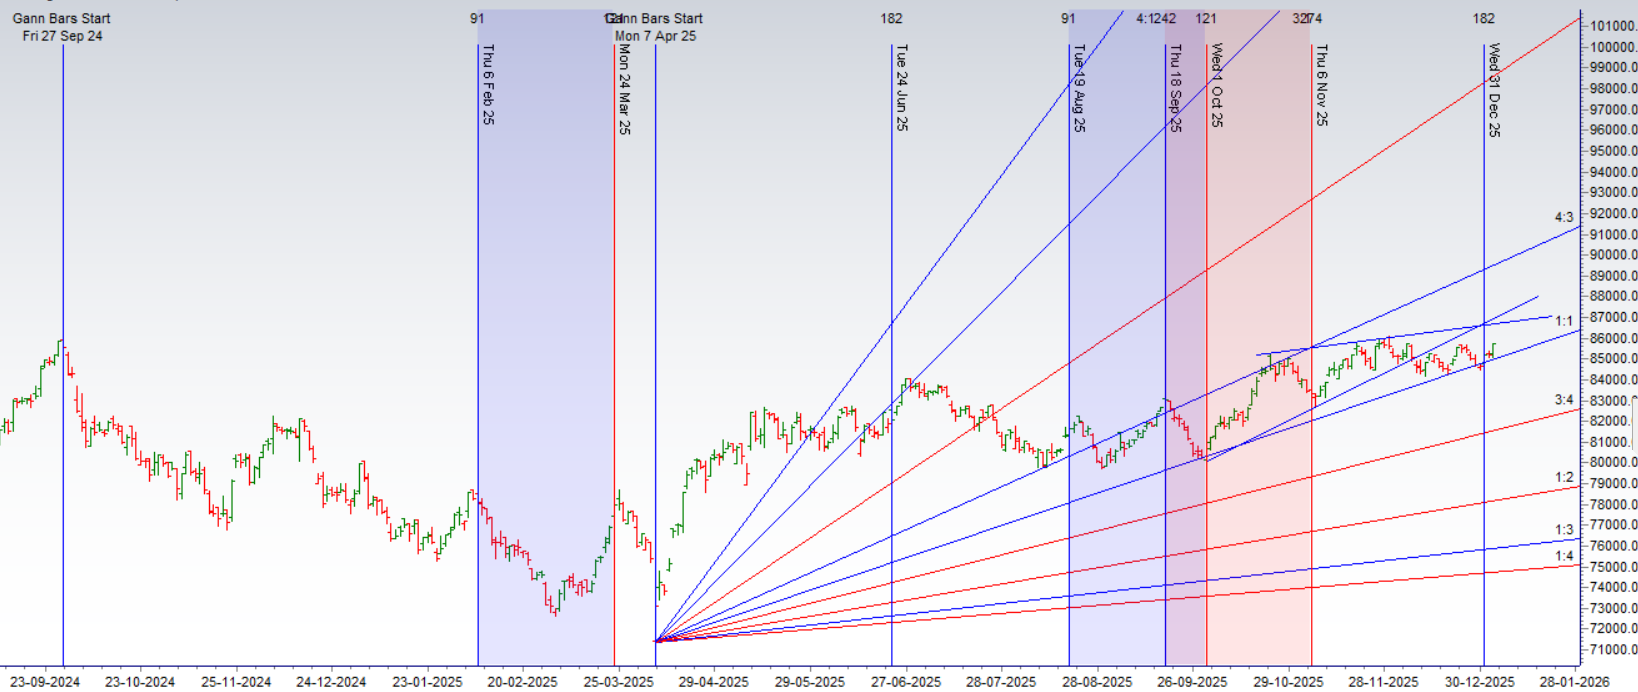
Sensex gave a perfect bounce from its 1×1 gann angle.
SENSEX Supply and Demand
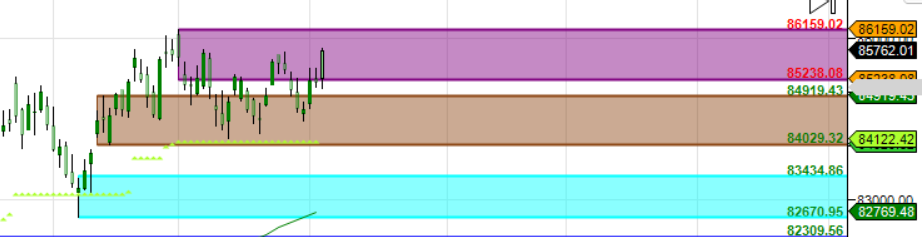
Self Explanatory Chart
Nifty 50 Forecast for 2026: “The Year of the Whip” – A Master Cycle Analysis
SENSEX Time Analysis Pressure Dates
Key Pivot Dates: Watch 05 Jan
SENSEX Weekly Chart
Weekly NR21 last week did its target on upside
SENSEX Monthly Charts
86200 is Monthly resistance zone 85176 is Support zone.
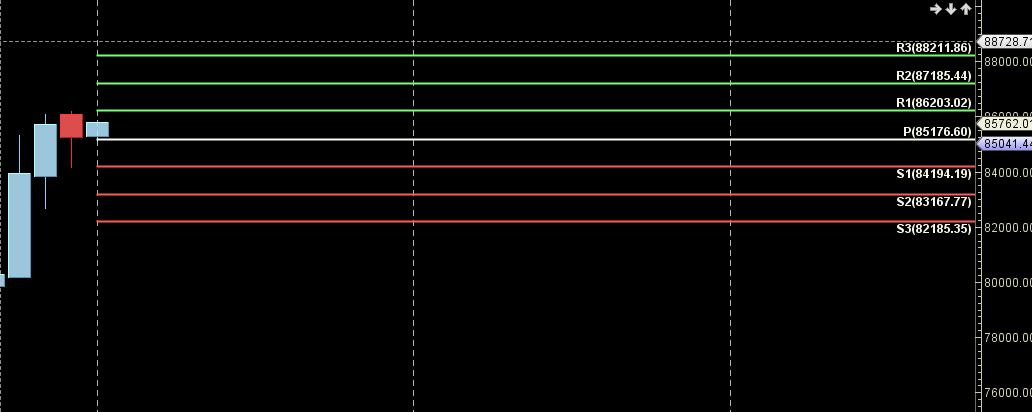
SENSEX Weekly Levels
SENSEX Trend Deciding Level: 85633
SENSEX Resistance: 85924,86214,86505,86796
SENSEX Support: 85342,85052,84761,84470
Levels mentioned are SENSEX Spot
Learn More:
W.D. Gann Trading Strategies – Learn how to decode markets using price, time, and geometry.
Trading Using Financial Astrology – Discover how planetary motion impacts market behavior and how to trade it effectively.
Ready to Trade Like a Time-Master?
Join our one-on-one mentorship to master astro-timing, Gann analysis, and institutional-grade setups.
Call: 09985711341
Email: bhandaribrahmesh@gmail.com