


Disclaimer
This analysis represents the highest-probability forecast derived from expert, multi-decade historical evaluation of astrological signatures and their documented correlation with market psychology and price action.
No Guarantee
This is not a guarantee of future market performance. Financial markets are influenced by numerous dynamic and unpredictable real-world factors. All trading and investment activities carry significant risk, including the potential loss of principal.
Educational Purpose Only
This content is strictly for informational and educational purposes and should not be construed as financial advice or a recommendation to buy, sell, or trade any financial instrument.
Consult a Professional
We strongly advise you to consult a qualified financial advisor before making any investment decisions. Any actions you take based on this analysis are solely your responsibility. We assume no liability for any financial profits or losses that may occur.
Theme for Sensex: The Bull Trap Closes, Setting Off a Sharp Decline
Sensex appear set for a classic bull trap this week. The move is likely to start with a strong-looking gap-up, giving the impression that the market is ready to break higher. That early strength draws in buyers at exactly the wrong time.
The rise is not expected to hold. Once prices hit a key resistance zone, the move should stall quickly and reverse. When that happens, selling pressure builds fast as trapped buyers rush to exit their positions. This leads to a steady and forceful decline rather than a slow pullback.
The pressure is expected to peak around the middle of the week, when fear and uncertainty reach their highest point and prices finally find a temporary bottom. While this phase may feel uncomfortable, it serves a purpose. It clears excess optimism and sets the stage for a larger trend shift. Toward the end of the week, reversal signals point to a strong rebound phase, marking the transition from weakness to recovery.
For a Detailed Day by Day Forecast with Neural Analysis Please watch the below video
SENSEX Harmonic Pattern
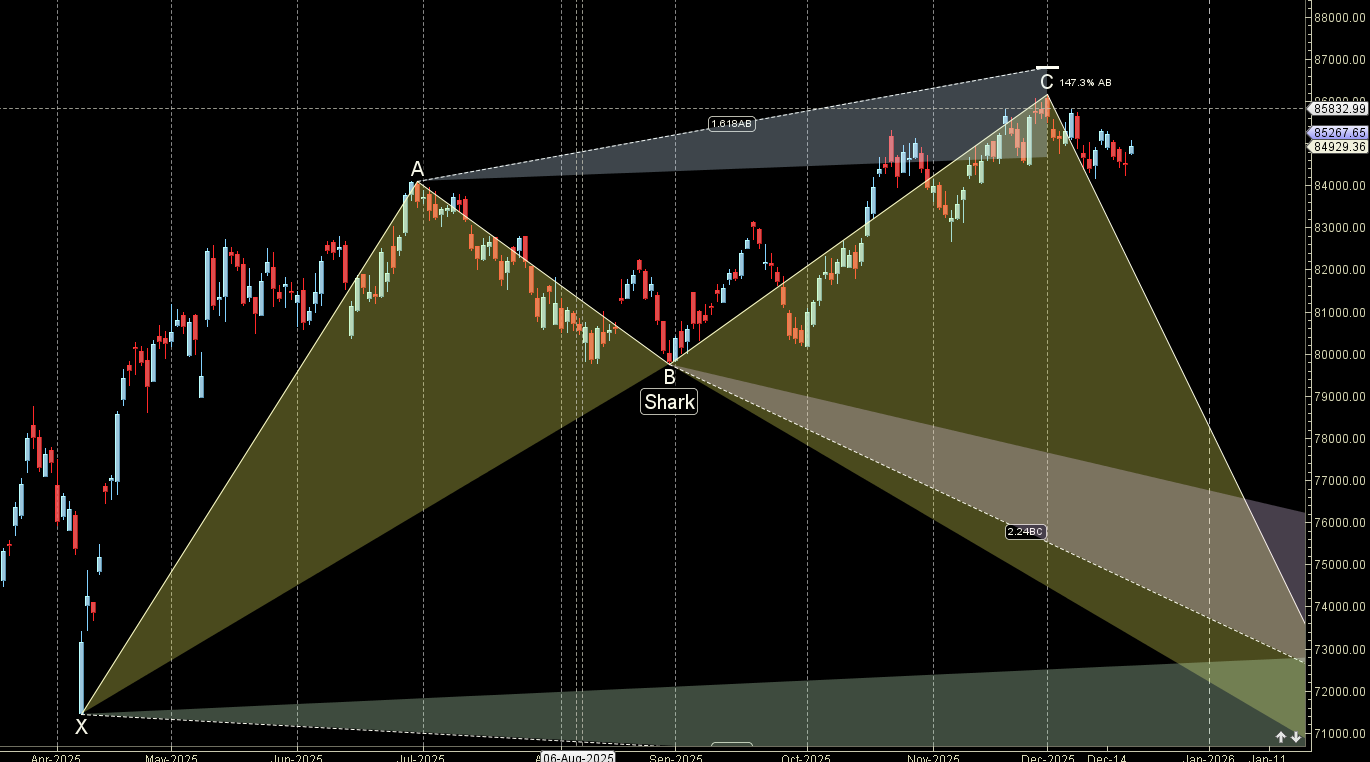
Sensex unable to cross SHARK pattern PRZ zone of 86000 fall towards 85000/84700
SENSEX Gann Angles
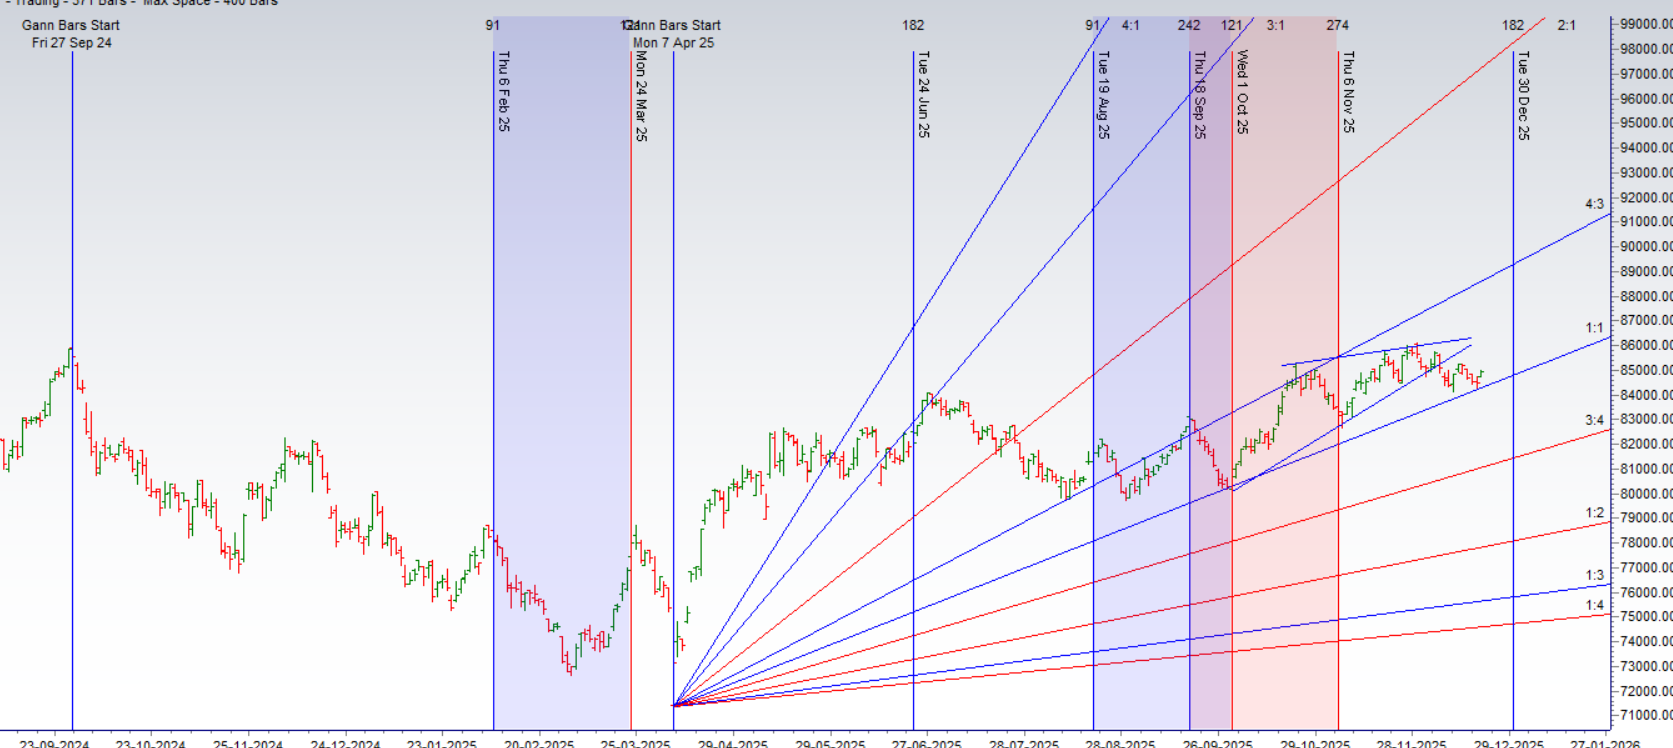
Sensex bounced from its 1×1 gann angle.
SENSEX Supply and Demand
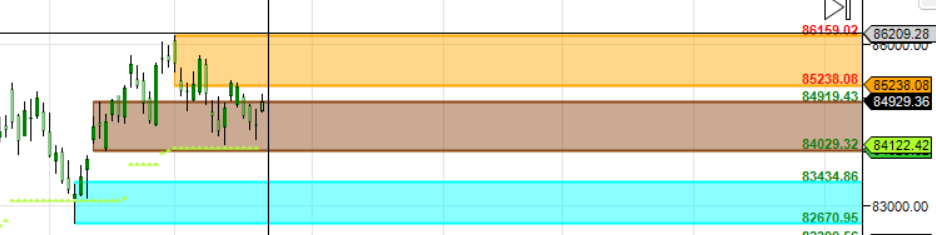
Self Explanatory Chart
SENSEX Time Analysis Pressure Dates
Key Pivot Dates: Watch 22 Dec
SENSEX Weekly Chart
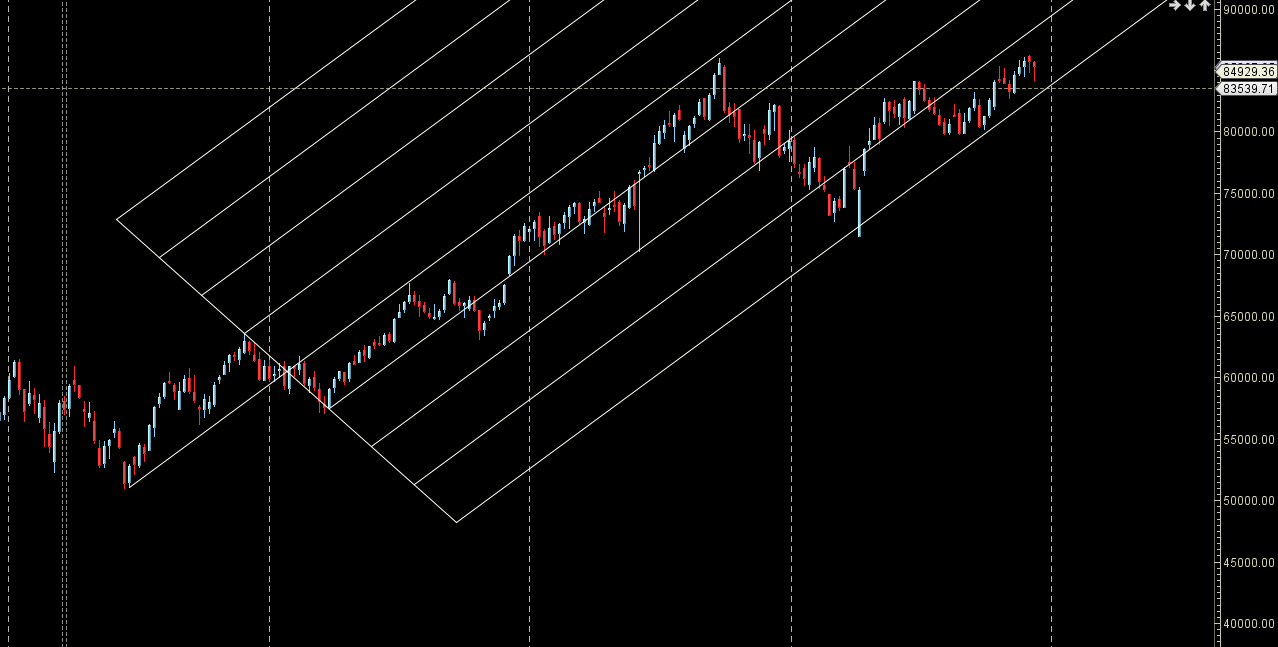
Weekly Lower Low with NR 7 pattern
SENSEX Monthly Charts
86100 is Monthly resistance zone 84500 is Support zone.
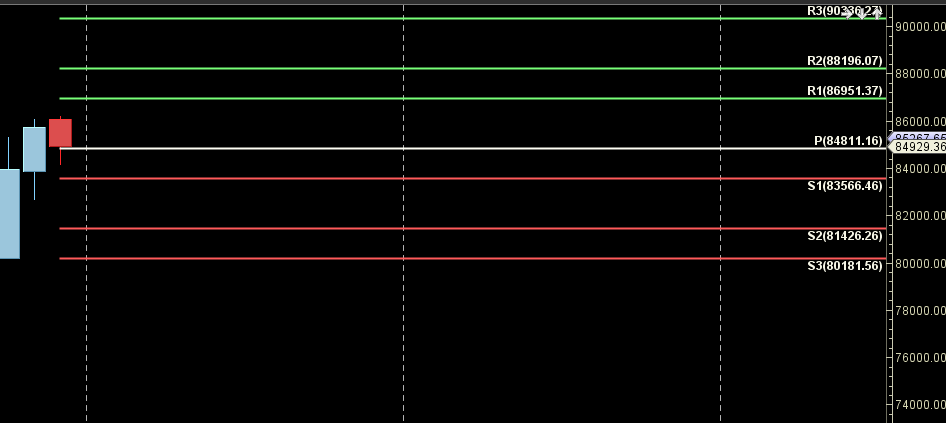
SENSEX Weekly Levels
SENSEX Trend Deciding Level: 85020
SENSEX Resistance: 85310,85600,85890,86180,86470
SENSEX Support: 84730,84440,84150,83888,83555
Levels mentioned are SENSEX Spot
Learn More:
W.D. Gann Trading Strategies – Learn how to decode markets using price, time, and geometry.
Trading Using Financial Astrology – Discover how planetary motion impacts market behavior and how to trade it effectively.
Ready to Trade Like a Time-Master?
Join our one-on-one mentorship to master astro-timing, Gann analysis, and institutional-grade setups.
Call: 09985711341
Email: bhandaribrahmesh@gmail.com