


Disclaimer : This analysis represents the highest-probability forecast derived from expert, multi-decade historical evaluation of astrological signatures and their documented correlation with market psychology and price action.
No Guarantee: This is not a guarantee of future market performance. Financial markets are influenced by numerous dynamic and unpredictable real-world factors. All trading and investment activities carry significant risk, including the potential loss of principal.
Educational Purpose Only :This content is strictly for informational and educational purposes and should not be construed as financial advice or a recommendation to buy, sell, or trade any financial instrument.
Consult a Professional :We strongly advise you to consult a qualified financial advisor before making any investment decisions. Any actions you take based on this analysis are solely your responsibility. We assume no liability for any financial profits or losses that may occur.
Theme for Silver: The False Start and The Safe-Haven Ignition
Silver’s price structure remains constructive, but the trade bias warrants restraint. Early equity strength is likely to weigh on Silver initially, keeping upside contained and encouraging shallow pullbacks rather than impulsive extensions. While price action suggests underlying demand, Silver typically requires confirmation from broader risk conditions before sustaining a directional move. That confirmation only arrives if the equity bull trap fails. Should the Venus–Saturn rejection coincide with a reversal in the Nifty, Silver can accelerate higher alongside Gold, but the move is expected to be more selective and volatility-driven rather than trend-expansive. Into mid-week, upside momentum may emerge, yet follow-through remains vulnerable to fading if equities stabilize too quickly. As the week progresses, Silver is more likely to consolidate than extend, reflecting a market that is structurally strong but tactically cautious.
For a Detailed Day by Day Forecast with Neural Analysis Please watch the below video
MCX Silver Gann Angle Chart
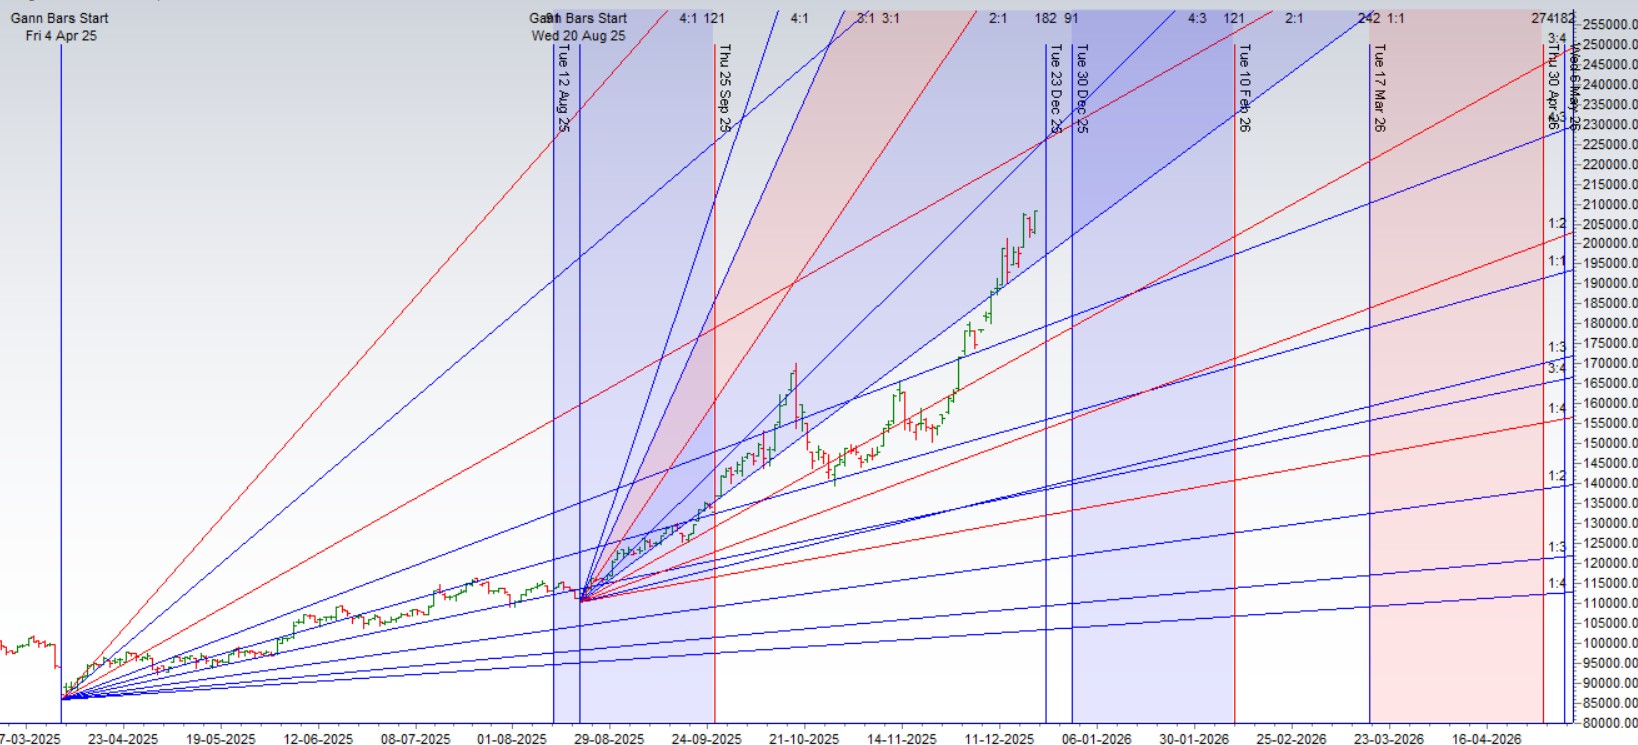
Silver is trading at its all time high approaching imp gann and astro cycle
MCX Silver Supply Demand Zone
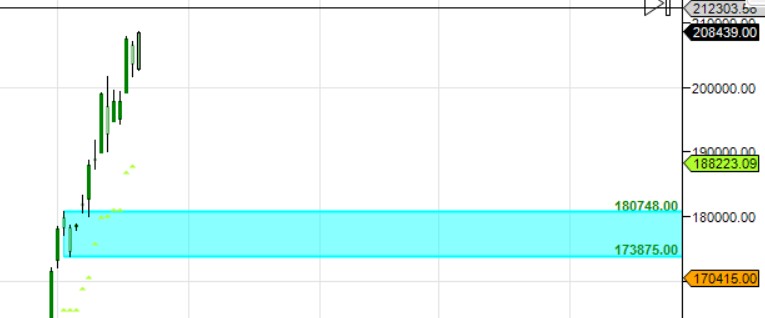
MCX SILVER Supply Demand Chart : Demand in range of 212-214 K , Supply in range of 200-201 K
MCX Silver Harmonic Analysis
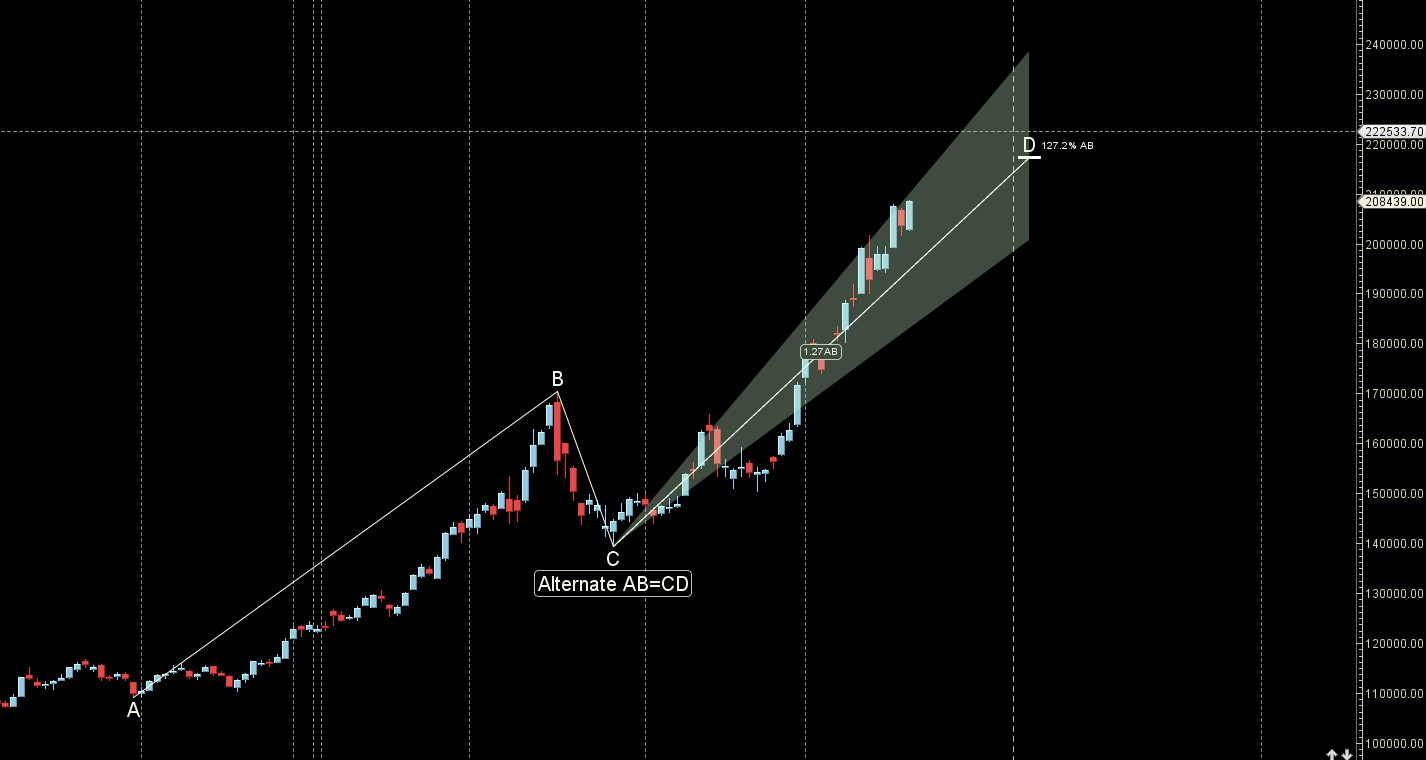
D leg can rally completed Break of 210 K fall towards 216/220 K
MCX Silver Weekly
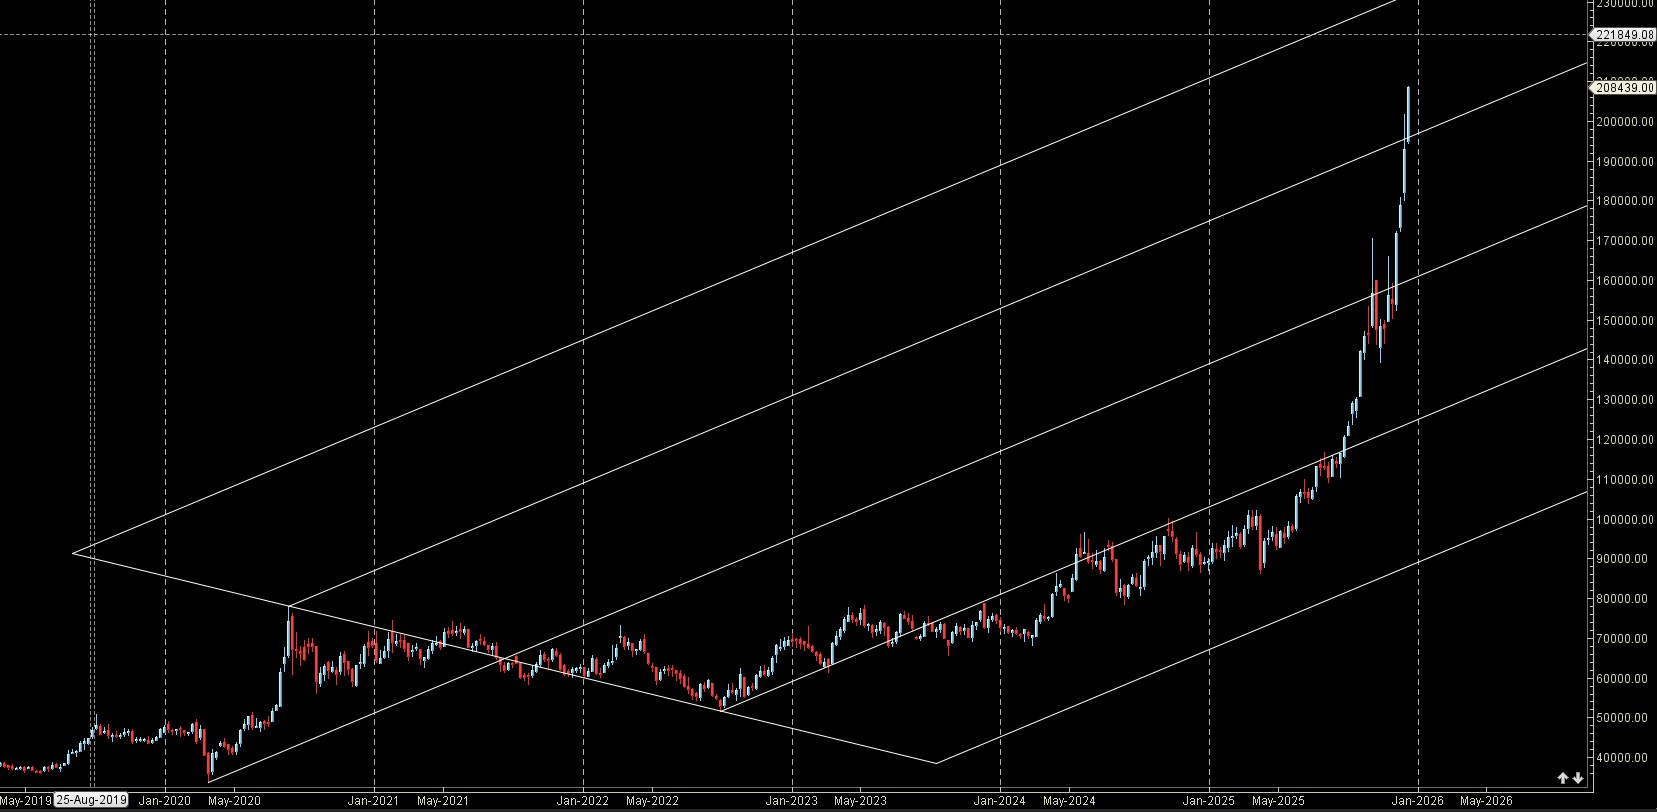
Weekly candel above AF resistance zone.
MCX Silver Monthly
212 K Monthly Resistance and 200 K Monthly Support.
Silver Astro/Gann Trend Change Date
Key Pivot Dates: Watch 22 Dec
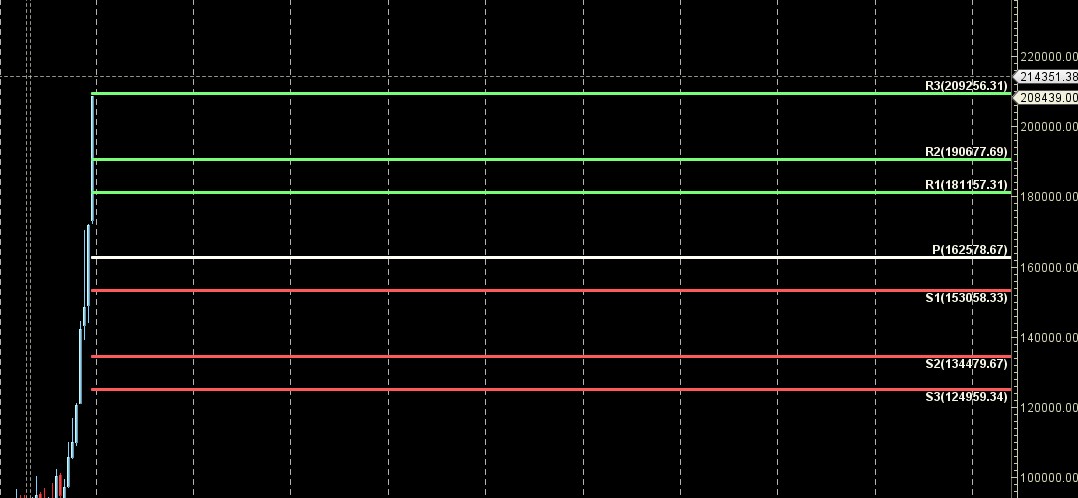
Silver Weekly Levels
Weekly Trend Change Level:207707
Weekly Resistance: 208620,209534,210451,211369,212290
Weekly Support: 206797,205888,204982,204077,203175
Levels Mentioned are for Current Month Future
Learn More:
W.D. Gann Trading Strategies – Learn how to decode markets using price, time, and geometry.
Trading Using Financial Astrology – Discover how planetary motion impacts market behavior and how to trade it effectively.
Ready to Trade Like a Time-Master?
Join our one-on-one mentorship to master astro-timing, Gann analysis, and institutional-grade setups.