


Disclaimer : This analysis represents the highest-probability forecast derived from expert, multi-decade historical evaluation of astrological signatures and their documented correlation with market psychology and price action.
No Guarantee: This is not a guarantee of future market performance. Financial markets are influenced by numerous dynamic and unpredictable real-world factors. All trading and investment activities carry significant risk, including the potential loss of principal.
Educational Purpose Only :This content is strictly for informational and educational purposes and should not be construed as financial advice or a recommendation to buy, sell, or trade any financial instrument.
Consult a Professional :We strongly advise you to consult a qualified financial advisor before making any investment decisions. Any actions you take based on this analysis are solely your responsibility. We assume no liability for any financial profits or losses that may occur.
Theme for Gold: The False Start and The Safe-Haven Ignition
Gold’s setup is the mirror image of the illusion playing out in equities. An early gap-up in stocks will look like a classic risk-on signal, but that surface strength will pressure Gold and briefly make it appear weak. That dip is not genuine selling—it is a deliberate shakeout meant to flush out weak long positions.
The real move in Gold begins only when the equity bull trap is exposed. As the Venus–Saturn rejection coincides with a reversal in the Nifty, capital will quickly rotate into safety. That is the trigger point. Gold responds sharply, gaining momentum as fear replaces confidence.
As the week progresses, rising uncertainty in the broader market fuels Gold’s advance, with momentum building into the middle of the week. By the time equities reach their own reversal zone later in the week, Gold shifts from expansion to consolidation—having already done its job and proven its role as the market’s insurance trade.
For a Detailed Day by Day Forecast with Neural Analysis Please watch the below video
MCX GOLD Gann Angle Chart
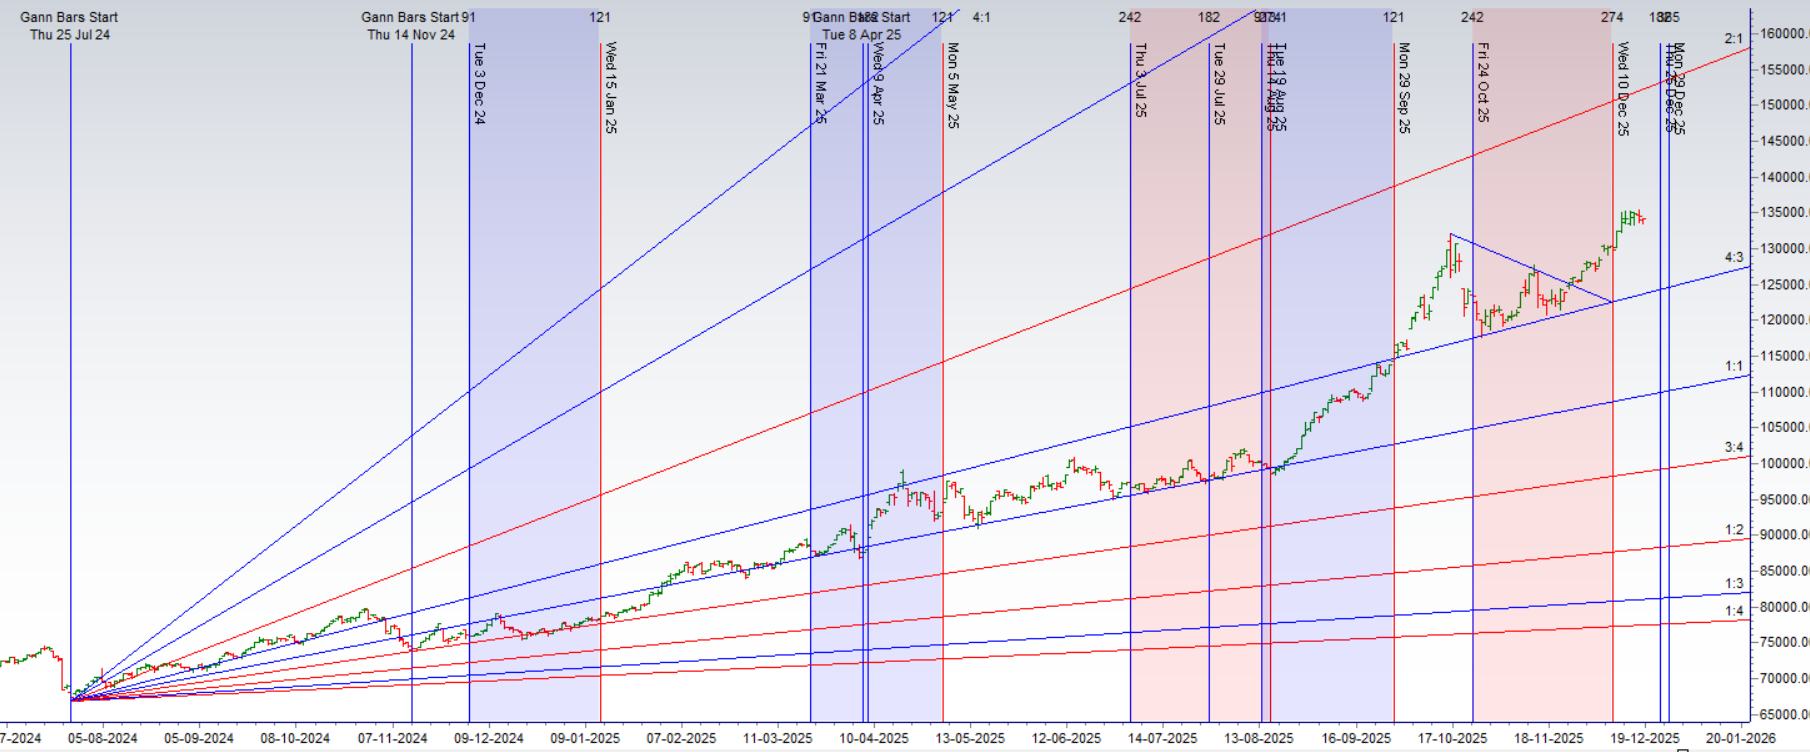
Gold has formed an NR7 on Daily and ready for a big move.
MCX GOLD Supply Demand Zone
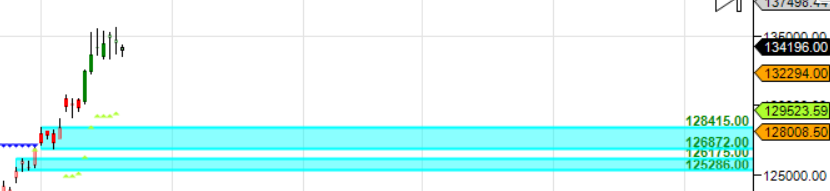
MCX GOLD Supply Demand Chart : Demand in range of 131500-131000 , Supply in range of 13500-135100
MCX GOLD Harmonic Analysis
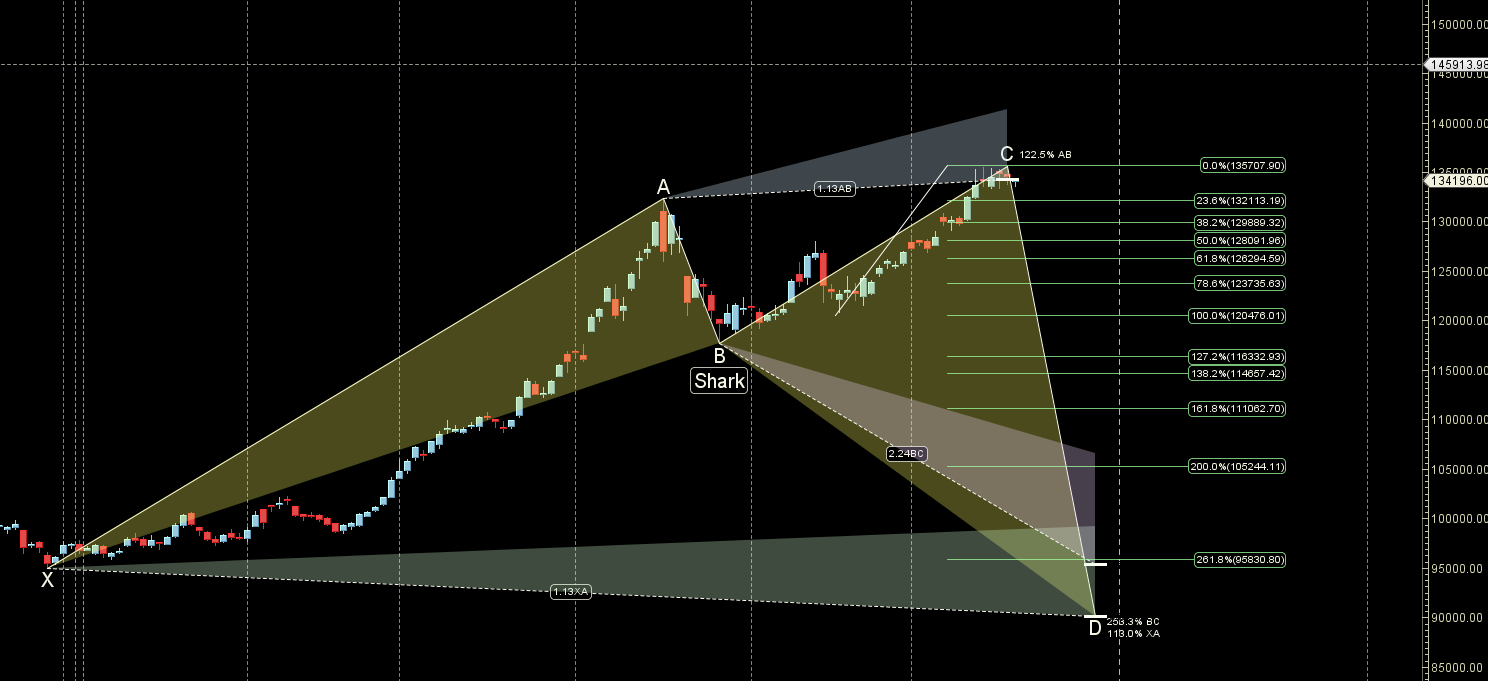
Unable to break 135 K can lead to decline towards 131 K
MCX GOLD Weekly
Gold has formed a Weekly DOJI
MCX GOLD Monthly
134000 Monthly Resistance and 131166 Monthly Support.
GOLD Astro/Gann Trend Change Date
Key Pivot Dates: Watch 22 Dec
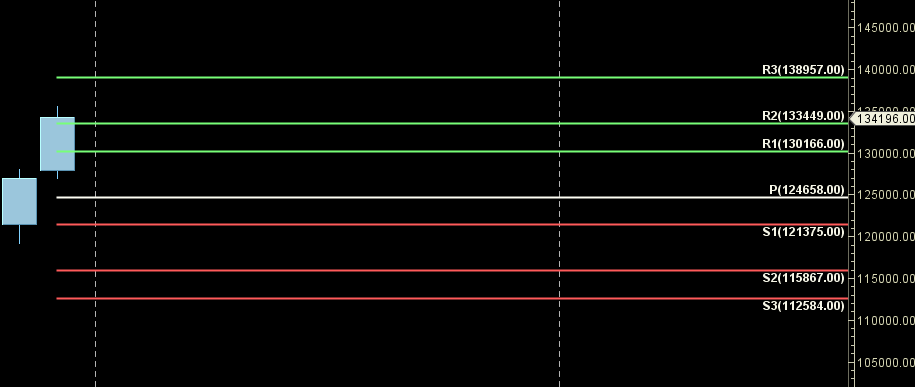
GOLD Weekly Levels
Weekly Trend Change Level:134096
Weekly Resistance: 134829,135565,136302,137041,137783
Weekly Support: 13364,132635,131908,131182,130459
Levels Mentioned are for Current Month Future
Learn More:
W.D. Gann Trading Strategies – Learn how to decode markets using price, time, and geometry.
Trading Using Financial Astrology – Discover how planetary motion impacts market behavior and how to trade it effectively.
Ready to Trade Like a Time-Master?
Join our one-on-one mentorship to master astro-timing, Gann analysis, and institutional-grade setups.