


Disclaimer : This analysis represents the highest-probability forecast derived from expert, multi-decade historical evaluation of astrological signatures and their documented correlation with market psychology and price action.
No Guarantee: This is not a guarantee of future market performance. Financial markets are influenced by numerous dynamic and unpredictable real-world factors. All trading and investment activities carry significant risk, including the potential loss of principal.
Educational Purpose Only :This content is strictly for informational and educational purposes and should not be construed as financial advice or a recommendation to buy, sell, or trade any financial instrument.
Consult a Professional :We strongly advise you to consult a qualified financial advisor before making any investment decisions. Any actions you take based on this analysis are solely your responsibility. We assume no liability for any financial profits or losses that may occur.
Theme for Gold : The Fear Spike Climax and The Trend Change Fade
The theme for Gold is a classic “fear spike and fade.” The narrative is perfectly synchronized to capitalize on the early-week equity market panic and then reverse as market conditions change. The initial breakdown in indices, driven by the Sun-Saturn hard aspect, will act as rocket fuel for a powerful flight-to-safety bid into precious metals. This will be a high-momentum rally. Gold’s price will climax mid-week, peaking at the point of maximum fear during the Lunar Eclipse capitulation in stocks. However, this rally is built on a temporary foundation. As the powerful Venusian trend change signals come into effect at the end of the week, triggering a reversal in equities, the reason for holding Gold will evaporate just as quickly as it appeared. The theme for Gold is a front-loaded rally that stalls and begins to reverse into the close, perfectly mirroring the broader market’s pivot from risk-off to risk-on.
For a Detailed Day by Day Forecast with Neural Analysis Please watch the below video
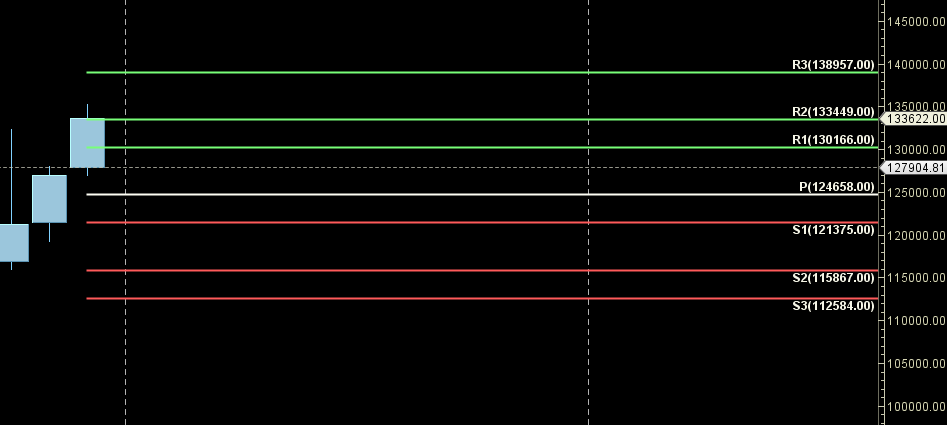
MCX GOLD Gann Angle Chart
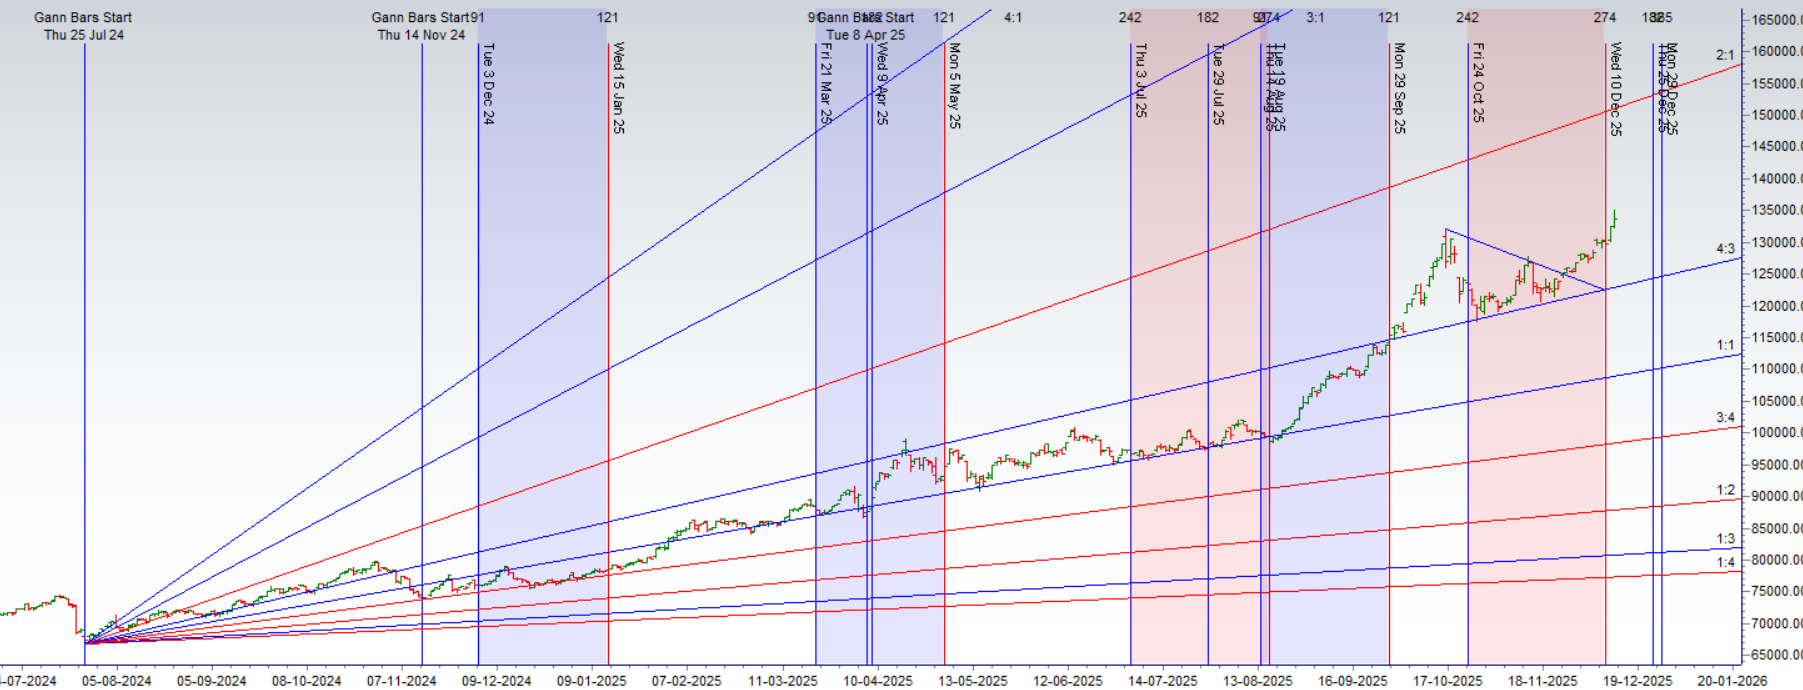
Gold is at its 1 Month high till but saw a selling after Mercury Ingress Break of 132866 can lead fall towards 130 K
MCX GOLD Supply Demand Zone
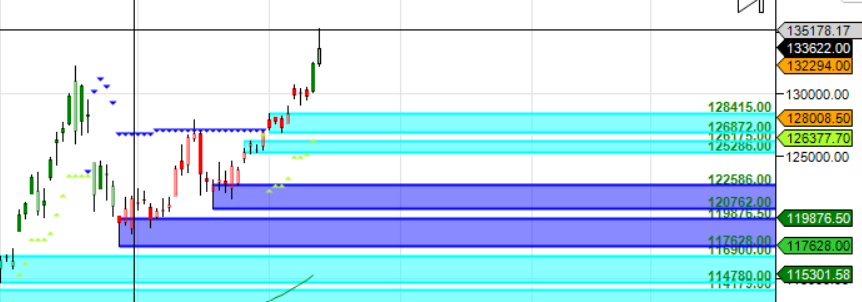
MCX GOLD Supply Demand Chart : Demand in range of 128415-128500 , Supply in range of 13500-135100
MCX GOLD Harmonic Analysis
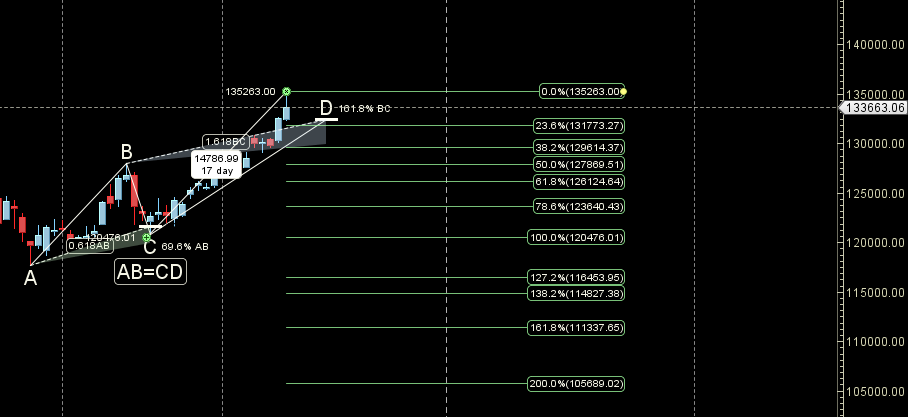
Unable to break 135 K can lead to decline towards 129-127 K
MCX GOLD Weekly
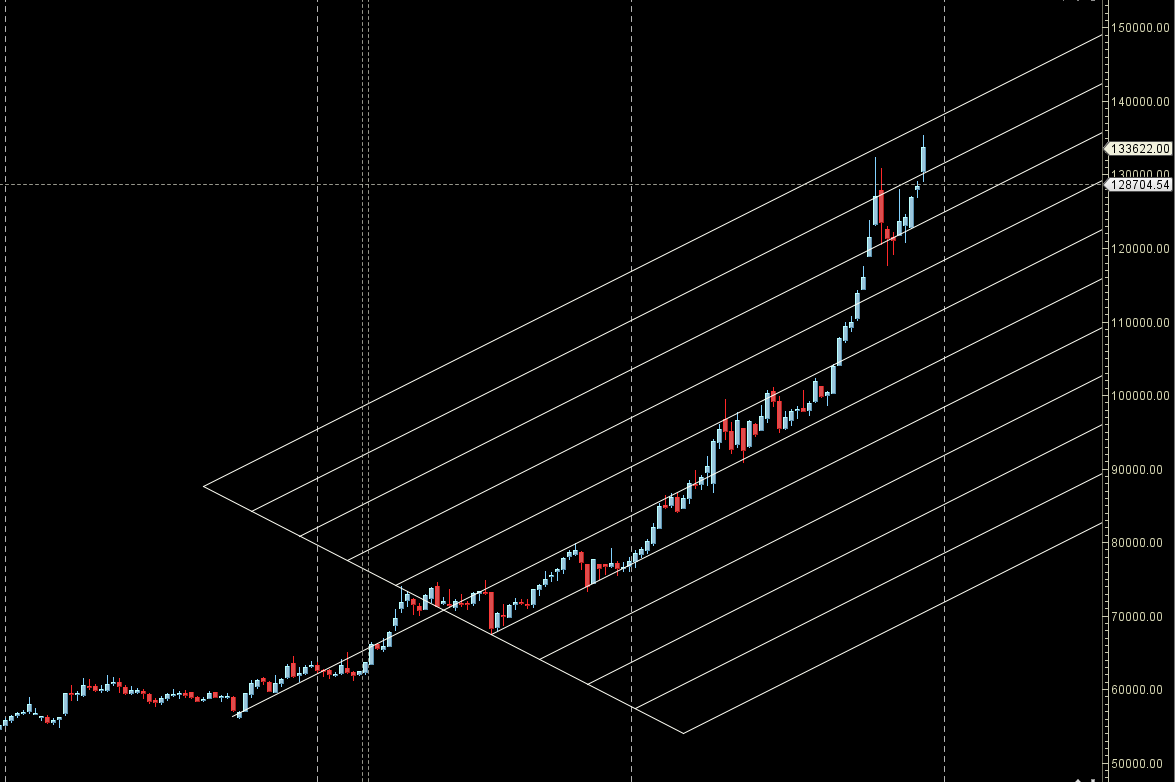
Gold reacted from Weekly AF support zone
MCX GOLD Monthly
134000 Monthly Resistance and 130166 Monthly Support.
GOLD Astro/Gann Trend Change Date
Key Pivot Dates: Watch 15/19 Dec
GOLD Weekly Levels
Weekly Trend Change Level:133596
Weekly Resistance: 134328,135062,135798,136536,137276
Weekly Support: 132866,132138,131412,130688,129966,129246,128528
Levels Mentioned are for Current Month Future
Learn More:
W.D. Gann Trading Strategies – Learn how to decode markets using price, time, and geometry.
Trading Using Financial Astrology – Discover how planetary motion impacts market behavior and how to trade it effectively.
Ready to Trade Like a Time-Master?
Join our one-on-one mentorship to master astro-timing, Gann analysis, and institutional-grade setups.