


SENSEX Daily Gann Chart

Price is heading towards 1×1 gann angle@84000-83900 till below 85000
SENSEX Daily Swing Chart

Outside Bar Pattern before RBI Policy
SENSEX Daily MA Chart
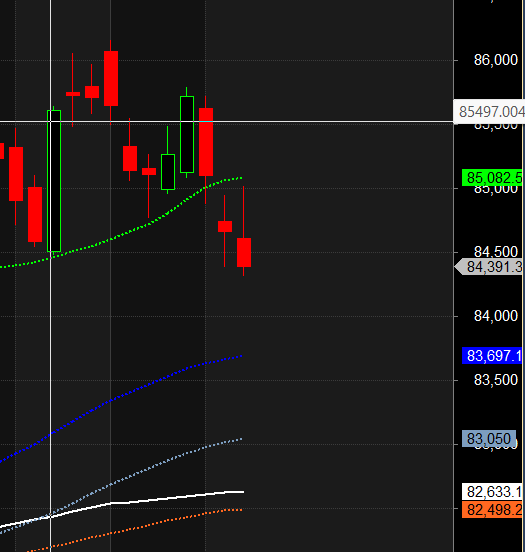
Price is below its 20 DMA heading towards 83697
SENSEX Musical Level Chart
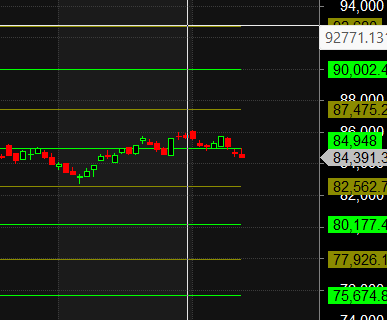
Traders who follow the musical octave trading path may find valuable insights in predicting Nifty’s movements. According to this path, SENSEX may follow a path of 80177-82562-84948-87475 This means that traders can take a position and potentially ride the move as SENSEX moves through these levels.Of course, it’s important to keep in mind that trading is inherently risky and market movements can be unpredictable.
SENSEX Options Data

The Sensex options data paints a picture of a market under severe bearish control. An extremely low Put-Call Ratio (PCR) of 0.49 indicates that call open interest is more than double that of puts. This is a sign of aggressive call writing by sellers who are confident that the market’s upside is firmly capped.
The market is currently pinned near the Max Pain level of 84,500, which is acting as a powerful magnet and the central pivot of a bearish trading range. The spot price at 84,391 is trapped just below this level, highlighting the immense pressure exerted by option sellers.
The option chain chart clearly defines the battlefield:
-
Resistance: A colossal “Great Wall of Calls” is visible at the 85,000 strike, which serves as the ultimate ceiling for any potential rally. Immediate resistance is found closer at the 84,500 – 84,600 zone.
-
Support: A formidable support floor has been built at the 84,000 strike, which holds the highest concentration of Put Open Interest. This level represents the primary line of defense for the bulls.
In conclusion, the Sensex is in a bear grip. The path of least resistance is sideways to down, locked within a range defined by the major support at 84,000 and the impenetrable resistance at 85,000.
Key Levels:
-
Resistance: Immediate resistance lies at 85,500, with the ultimate ceiling for this expiry located at 86,000, which holds the highest concentration of Call OI.
-
Support: Major support is firmly established at 85,000, with a secondary floor at 84,500.
The setup suggests a “buy on dips” environment, with the upside capped only by the major call resistance at 86,000.
SENSEX Trade Plan for Positional Trading
Key Levels for Positional Traders
-
Bulls will take control above 84625 → Potential rally towards 84918/85210
-
Bears will dominate below 84332 → Possible decline towards 84039/83746
SENSEX Intraday Time :
Traders may watch out for potential intraday reversals at 09:15,10:45,12:25,02:15 How to Find and Trade Intraday Reversal Times
SENSEX Expiry Range
Upper End of Expiry : 84861
Lower End of Expiry : 83890
SENSEX Intraday Trading Levels
Buy Above 84510 Tgt 84656, 84802 and 85000 ( SENSEX Spot Levels)
Sell Below 84364 Tgt 84219, 84073 and 83927 (SENSEX Spot Levels)
Wishing you good health and trading success as always.As always, prioritize your health and trade with caution.
As always, it’s essential to closely monitor market movements and make informed decisions based on a well-thought-out trading plan and risk management strategy. Market conditions can change rapidly, and it’s crucial to be adaptable and cautious in your approach.
► Join Youtube channel : Click here
► Check out Gann Course Details: W.D. Gann Trading Strategies
► Check out Financial Astrology Course Details: Trading Using Financial Astrology
► Check out Gann Astro Indicators Details: Gann Astro Indicators