


Disclaimer
This analysis represents the highest-probability forecast derived from expert, multi-decade historical evaluation of astrological signatures and their documented correlation with market psychology and price action.
No Guarantee
This is not a guarantee of future market performance. Financial markets are influenced by numerous dynamic and unpredictable real-world factors. All trading and investment activities carry significant risk, including the potential loss of principal.
Educational Purpose Only
This content is strictly for informational and educational purposes and should not be construed as financial advice or a recommendation to buy, sell, or trade any financial instrument.
Consult a Professional
We strongly advise you to consult a qualified financial advisor before making any investment decisions. Any actions you take based on this analysis are solely your responsibility. We assume no liability for any financial profits or losses that may occur.
This week is a textbook astrological setup for a classic “shakeout and reversal” pattern. The market narrative is a tale of two distinct and opposing halves. The first act, from Monday to Wednesday, is governed by extremely restrictive and chaotic bearish astrology. It begins with the brutal Mars Square Saturn aspect combined with a major top signal from Bayer Rule 27, engineered to trigger a hard rejection at a key supply zone and initiate a sharp, fear-driven downtrend. This move is designed to punish trapped longs and force capitulation. The breakdown will be amplified mid-week by the Mercury-Uranus opposition, a classic trigger for an information shock and a high-velocity liquidation event. The second act, however, brings a dramatic reversal. The psychological pivot occurs on Thursday with Mercury’s ingress into optimistic Sagittarius. This signals an aggressive reversal of sentiment from fear to “risk-on,” leading to a powerful, V-shaped recovery and short-squeeze into the end of the week. Traders must prepare for extreme volatility and a major reversal mid-week.
For Day by Day Forecast Please watch the below video
Nifty Harmonic Pattern
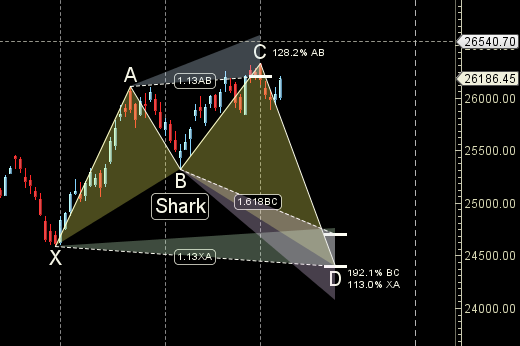
Nifty bulls need to break 26325 to invalidate the SHARK pattern.
Nifty Gann Angles
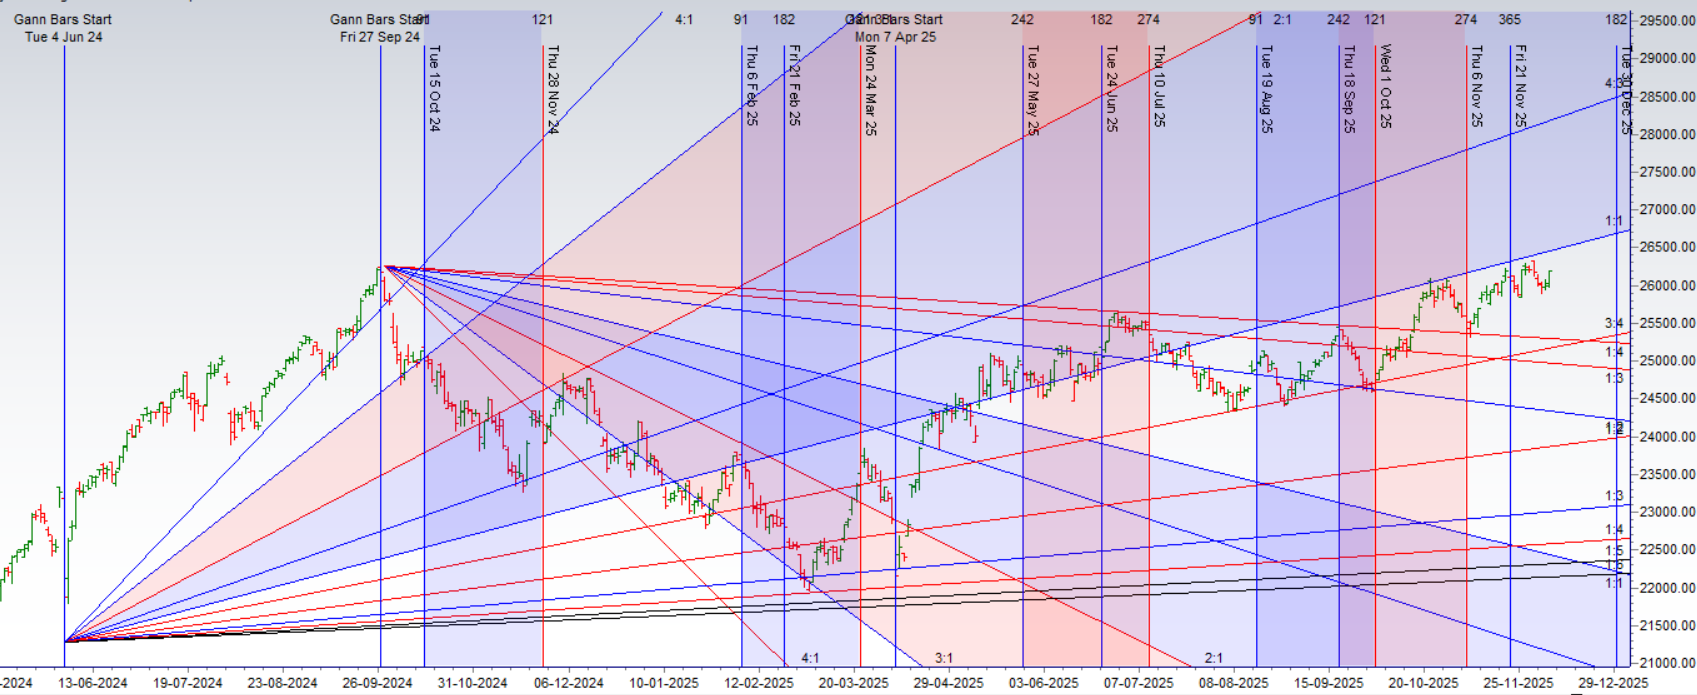
Price has bounced from gann angle support zone
Nifty Supply and Demand
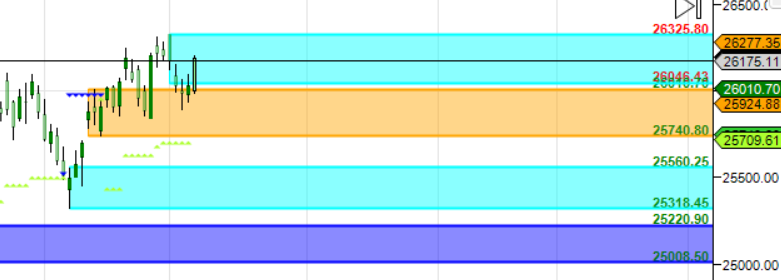
Self Explanatory Chart
Nifty Time Analysis Pressure Dates
Key Pivot Dates: Watch 08/11 Dec
Nifty Weekly Chart
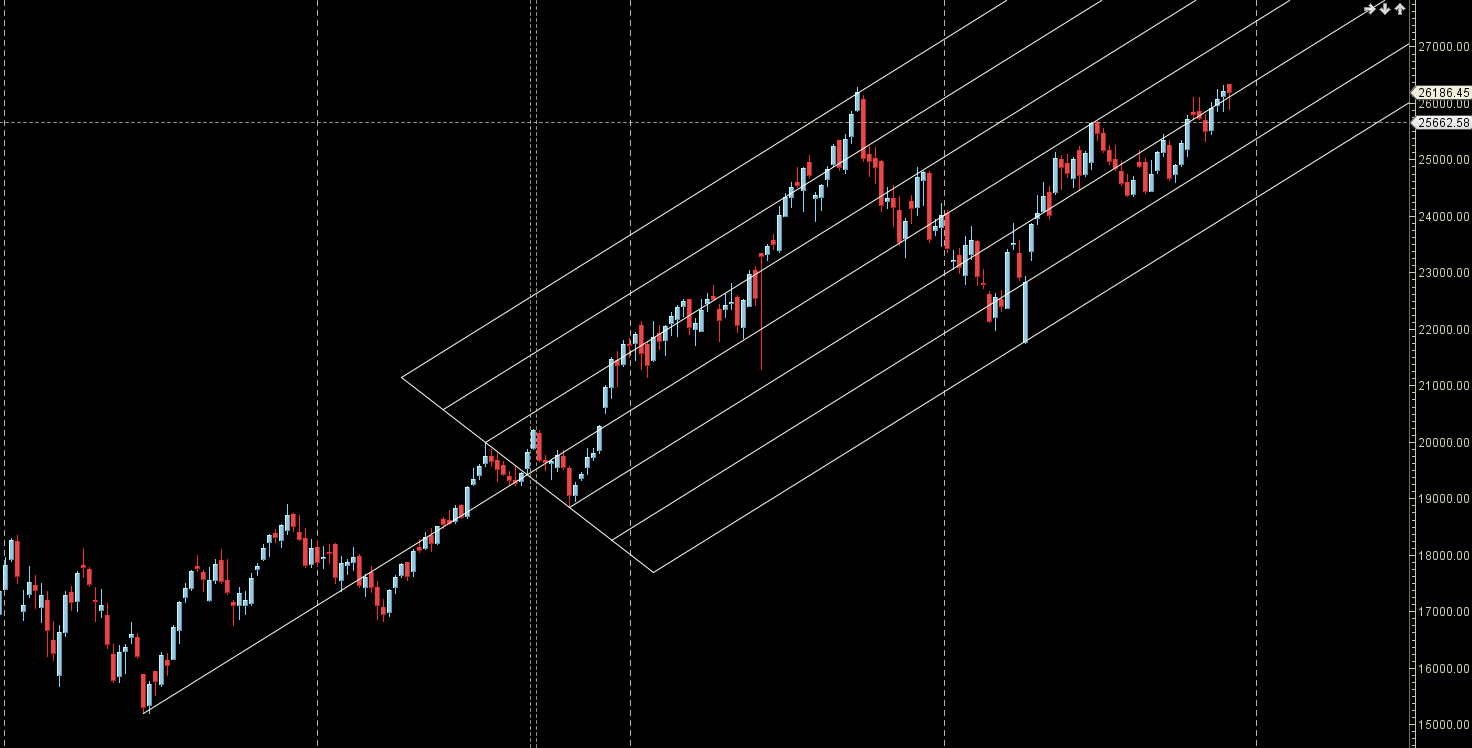
Weekly Higher High at above AF Resistance zone
Nifty Monthly Charts
26348 is Monthly resistance zone 25800 is Monthly Support zone.
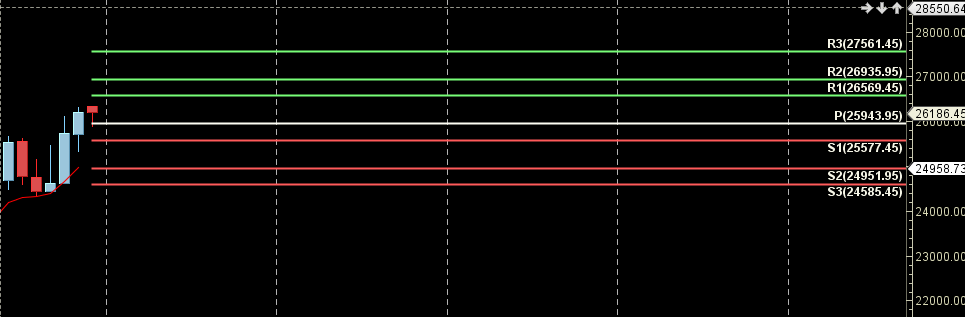
Nifty Weekly Levels
Nifty Trend Deciding Level: 26212
Nifty Resistance: 26293,26373,26454,26534
Nifty Support: 26132,26051,25971,25891
Levels mentioned are Nifty Spot
As always I wish you maximum health and trading success
Learn More:
W.D. Gann Trading Strategies – Learn how to decode markets using price, time, and geometry.
Trading Using Financial Astrology – Discover how planetary motion impacts market behavior and how to trade it effectively.
Ready to Trade Like a Time-Master?
Join our one-on-one mentorship to master astro-timing, Gann analysis, and institutional-grade setups.
Call: 09985711341
Email: bhandaribrahmesh@gmail.com