


SENSEX Daily Gann Chart
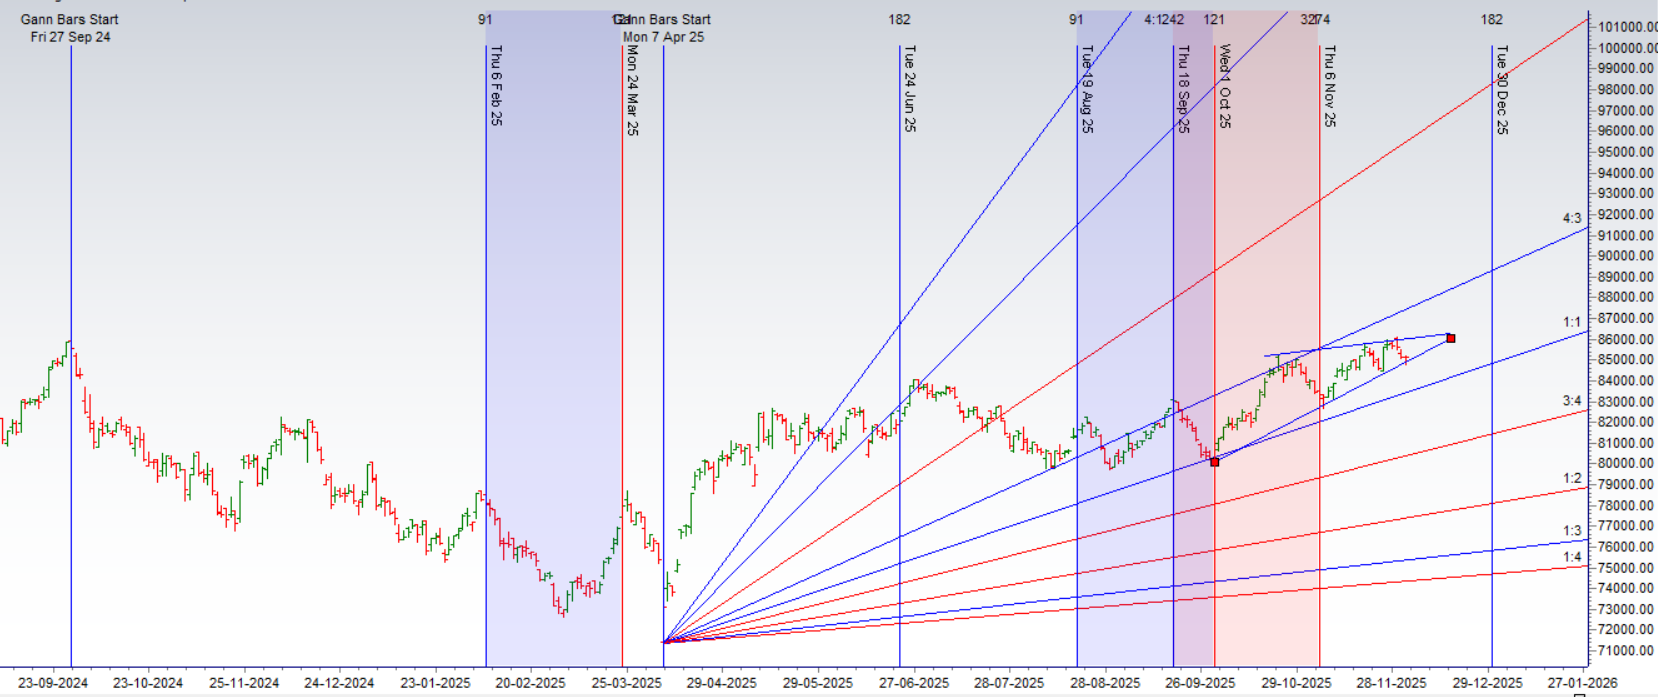
Price is lower end of trading range.
SENSEX Daily Swing Chart

Price need to cross important supply zone of 85250-85300 as discussed in video based on multiple studies.
SENSEX Musical Level Chart

Traders who follow the musical octave trading path may find valuable insights in predicting Nifty’s movements. According to this path, SENSEX may follow a path of 80177-82562-84948-87475 This means that traders can take a position and potentially ride the move as SENSEX moves through these levels.Of course, it’s important to keep in mind that trading is inherently risky and market movements can be unpredictable.
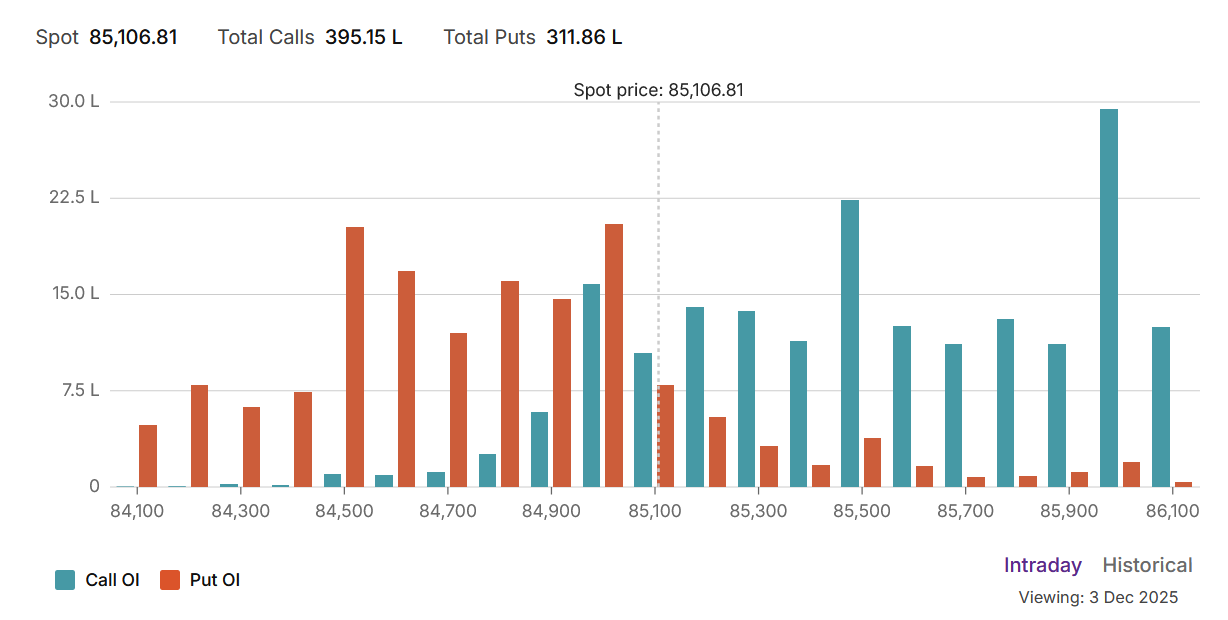
The Sensex options market is signaling a distinct shift towards a bearish-to-neutral stance, with caution replacing the recent bullish fervor. This is clearly indicated by a Put-Call Ratio (PCR) that has dropped to a cautious 0.79. This value, well below the neutral 1.0 mark, signifies that call writers have become more aggressive, betting with conviction that the market’s upside is limited. This surge in call open interest reflects a belief that the rally has encountered significant headwinds.
This sentiment is structurally confirmed by the Max Pain level, which is pegged at 85,100. This acts as a powerful financial center of gravity for the index, the point where option sellers will reap the maximum profit. The market is likely to remain tethered to this pivot, with option writers actively defending the range to ensure an expiry near this point.
The OI data has carved out a clear and formidable battlefield:
-
Resistance: The aggressive call writing has built a significant resistance ceiling. The primary barrier is located at 85,500, with a more formidable “Great Wall” of Call OI standing at the major psychological level of 86,000. These levels will be extremely difficult for the bulls to breach.
-
Support: A strong support floor has been established by put writers at the crucial 85,000 strike. This is the main line of defense for the bulls. Should this level fail, the next major support zone is located at 84,500.
In conclusion, the Sensex is now in a classic consolidation phase with a clear bearish tilt. The upside momentum has been checked by a wall of call sellers, pinning the market in a range defined by the support at 85,000 and resistance at 85,500. The path of least resistance is now sideways to down.
SENSEX Trade Plan for Positional Trading
Key Levels for Positional Traders
-
Bulls will take control above 85300 → Potential rally towards 85572/85865
-
Bears will dominate below 84984 → Possible decline towards 84691/84397
SENSEX Intraday Time :
Traders may watch out for potential intraday reversals at 10:32.11:22,01:29,02:35 How to Find and Trade Intraday Reversal Times
SENSEX Expiry Range
Upper End of Expiry : 85605
Lower End of Expiry : 84606
SENSEX Intraday Trading Levels
Buy Above 85114 Tgt 85261, 85407 and 85729 ( SENSEX Spot Levels)
Sell Below 84968 Tgt 84822, 84676 and 84529 (SENSEX Spot Levels)
Wishing you good health and trading success as always.As always, prioritize your health and trade with caution.
As always, it’s essential to closely monitor market movements and make informed decisions based on a well-thought-out trading plan and risk management strategy. Market conditions can change rapidly, and it’s crucial to be adaptable and cautious in your approach.
► Join Youtube channel : Click here
► Check out Gann Course Details: W.D. Gann Trading Strategies
► Check out Financial Astrology Course Details: Trading Using Financial Astrology
► Check out Gann Astro Indicators Details: Gann Astro Indicators