


Disclaimer : This analysis represents the highest-probability forecast derived from expert, multi-decade historical evaluation of astrological signatures and their documented correlation with market psychology and price action.
No Guarantee: This is not a guarantee of future market performance. Financial markets are influenced by numerous dynamic and unpredictable real-world factors. All trading and investment activities carry significant risk, including the potential loss of principal.
Educational Purpose Only :This content is strictly for informational and educational purposes and should not be construed as financial advice or a recommendation to buy, sell, or trade any financial instrument.
Consult a Professional :We strongly advise you to consult a qualified financial advisor before making any investment decisions. Any actions you take based on this analysis are solely your responsibility. We assume no liability for any financial profits or losses that may occur.
Weekly Market Forecast: The Great Reversal & The Lunar Climax
We have Saturn (structure/long-term trend) turning Direct on Nov 28, followed immediately by Mercury (short-term volatility/trading psychology) turning Direct on Nov 29. This is a rare “Double Station” event.
Gold & Silver Narrative: “The Helio Velocity Spike.” Precious metals are strictly governed by Heliocentric aspects this week. The “Bayer Rule 38” activation (Mercury Latitude Helio) on Dec 3 and Dec 4 is the smoking gun for Gold. These specific helio-latitudes are historically correlated with “mighty fine tops and bottoms” in commodities. Combined with the Perigee Moon on Dec 4 (maximum gravitational/emotional pull), Gold is set for a violent intraday swing. The narrative here is “Trap the Bulls, Squeeze the Bears,” ending with a decisive directional move on the Full Moon.
For a Detailed Day by Day Forecast with Neural Analysis Please watch the below video
MCX Silver Gann Angle Chart
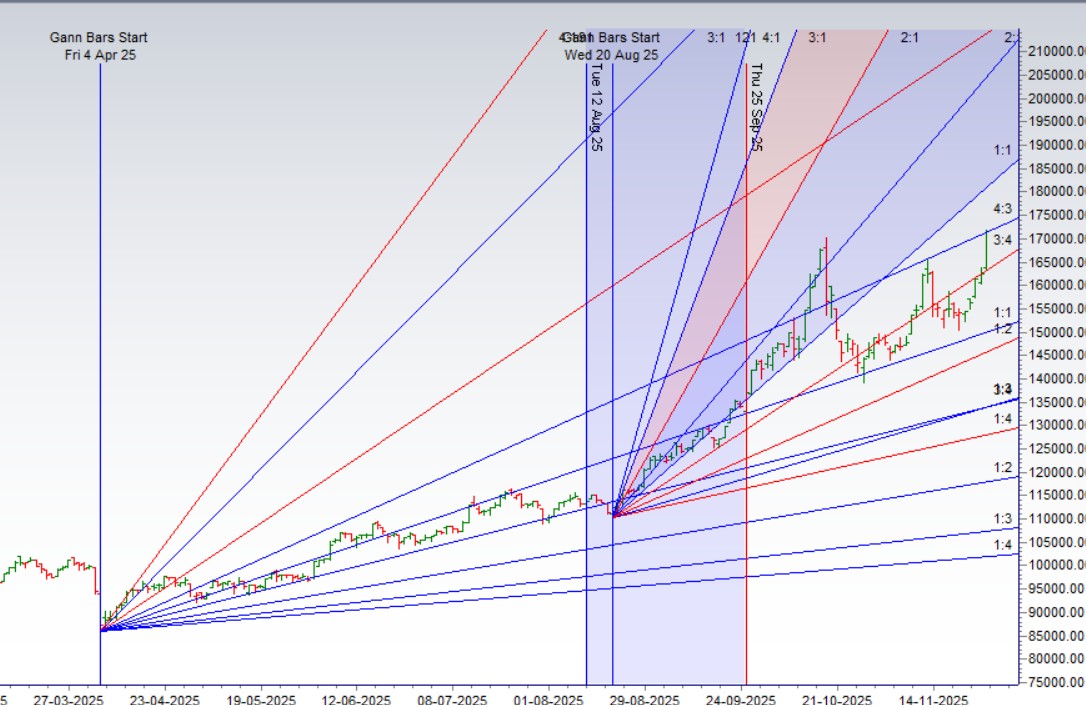
Silver is back to its 4×3 gann angle resistance zone break of 169K only can lead to bearish move else upsise till 175/178 K
MCX Silver Supply Demand Zone
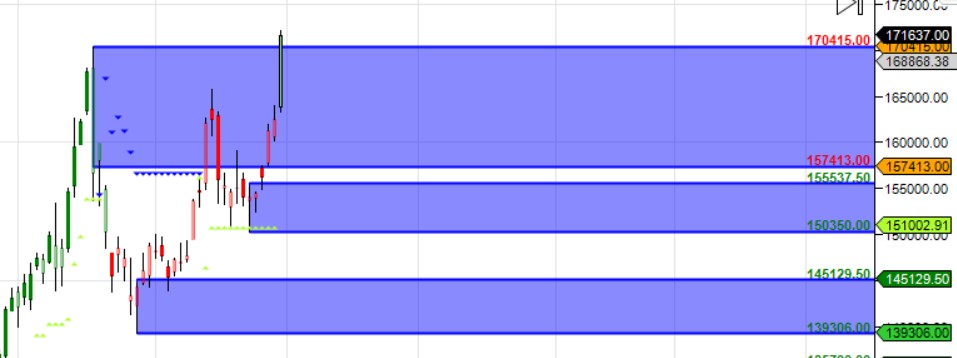
MCX SILVER Supply Demand Chart : Demand in range of 170-169K , Supply in range of 174-175 K
MCX Silver Harmonic Analysis
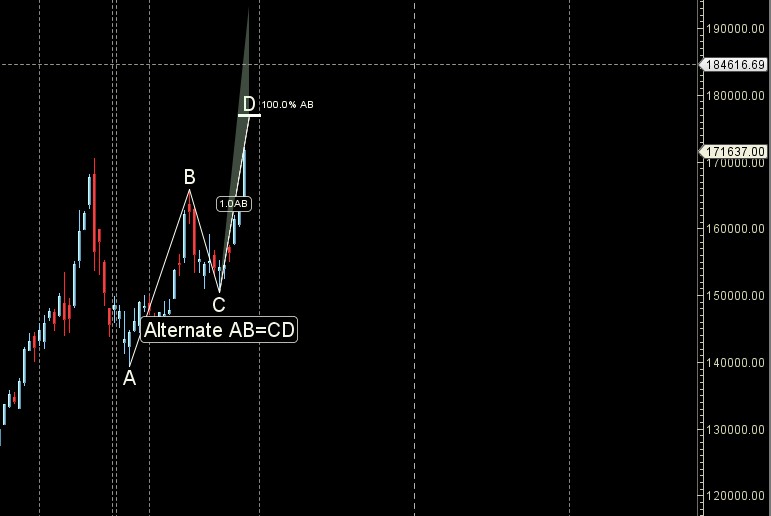
D leg can rally till 178 K
MCX Silver Weekly
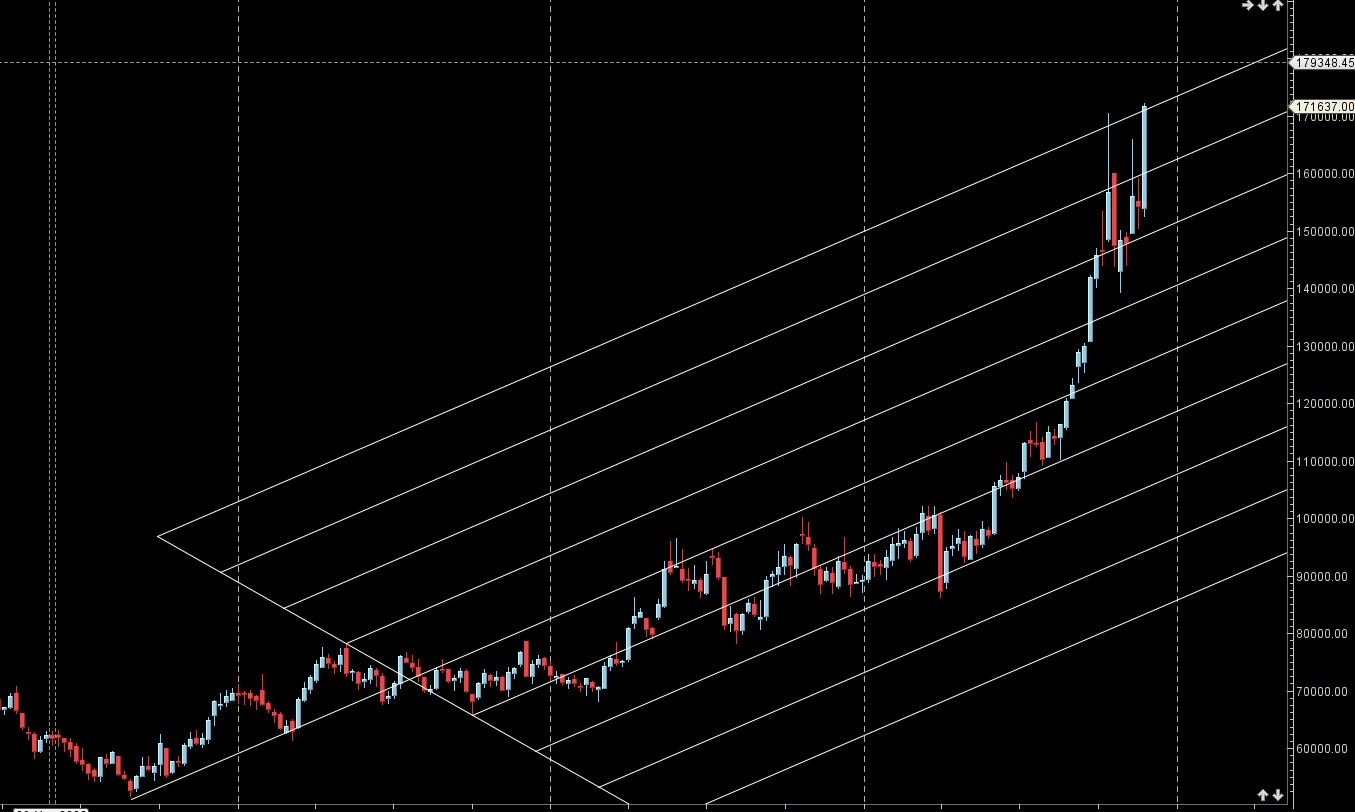
Weekly candel back to AF resistance zone.
MCX Silver Monthly
178K Monthly Resistance and 166 K Monthly Support.
Silver Astro/Gann Trend Change Date
Key Pivot Dates: Watch 01 Dec/05 Dec
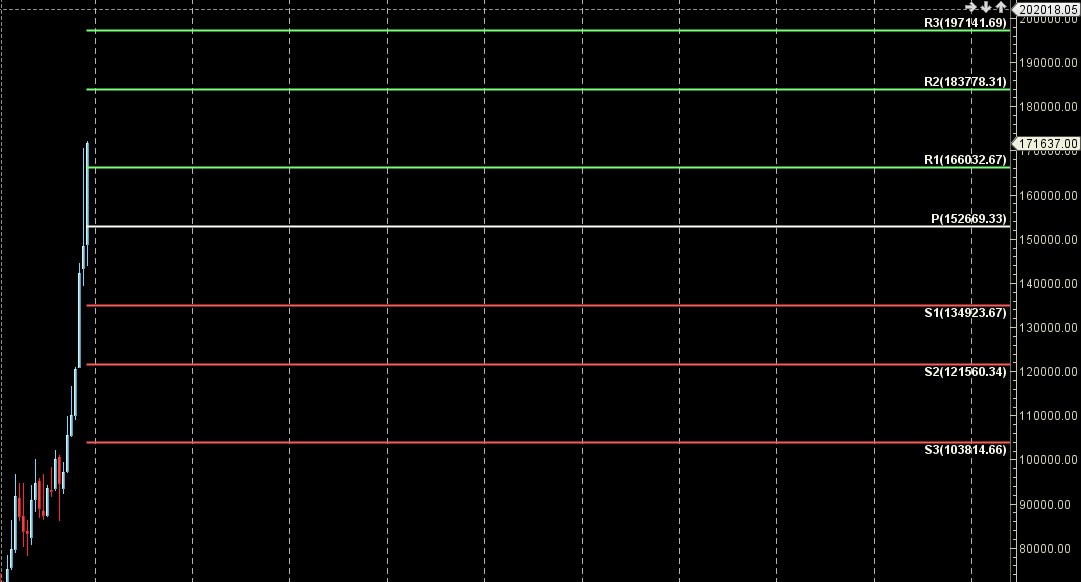
Silver Weekly Levels
Weekly Trend Change Level:172118
Weekly Resistance: 172949,173782,174617,175453,176292
Weekly Support: 171290,170463,169638,168815,167995,167176
Levels Mentioned are for Current Month Future
Learn More:
W.D. Gann Trading Strategies – Learn how to decode markets using price, time, and geometry.
Trading Using Financial Astrology – Discover how planetary motion impacts market behavior and how to trade it effectively.
Ready to Trade Like a Time-Master?
Join our one-on-one mentorship to master astro-timing, Gann analysis, and institutional-grade setups.