


Disclaimer
This analysis represents the highest-probability forecast derived from expert, multi-decade historical evaluation of astrological signatures and their documented correlation with market psychology and price action.
No Guarantee
This is not a guarantee of future market performance. Financial markets are influenced by numerous dynamic and unpredictable real-world factors. All trading and investment activities carry significant risk, including the potential loss of principal.
Educational Purpose Only
This content is strictly for informational and educational purposes and should not be construed as financial advice or a recommendation to buy, sell, or trade any financial instrument.
Consult a Professional
We strongly advise you to consult a qualified financial advisor before making any investment decisions. Any actions you take based on this analysis are solely your responsibility. We assume no liability for any financial profits or losses that may occur.
Sensex Narrative: “The Structural Pivot. The Indian indices are poised for a definitive break from recent consolidation. Saturn turning Direct in Pisces (25PI09) commands a halt to the previous trend. If the market has been correcting, this marks the rigid floor. If it has been rallying, this is the concrete ceiling. The presence of Bayer Rule 1 (Mercury Direction Change) and Bayer Rule 27 (Mercury Speed) bookending the week signals that the Sensex will likely trap retail traders on Monday before revealing the true institutional direction by Wednesday. The Equatorial Passage guarantees a trend change; do not fight the reversal mid-week.
For Day by Day Forecast Please watch the below video
SENSEX Harmonic Pattern
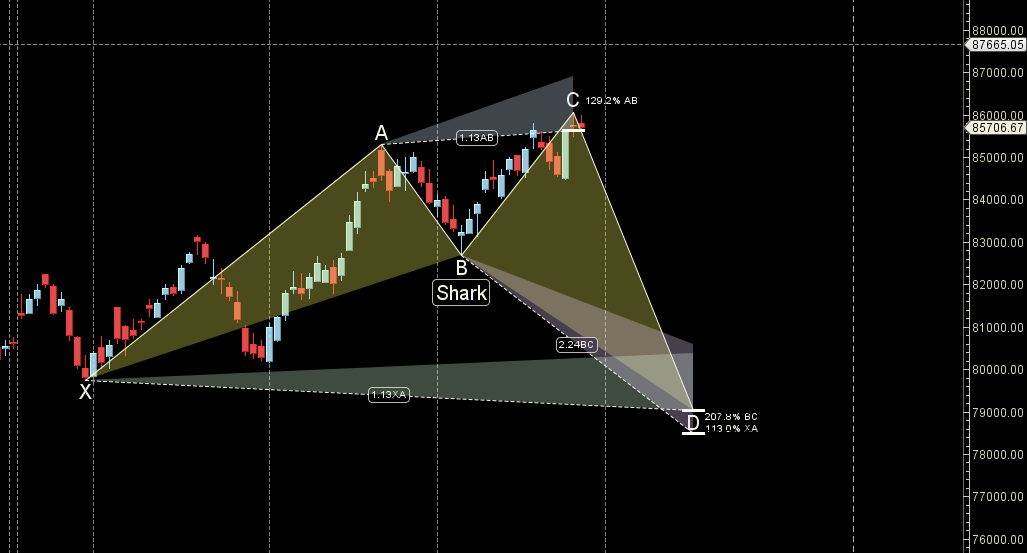
Sensex SHARK pattern PRZ zone of 86430-87000
SENSEX Gann Angles
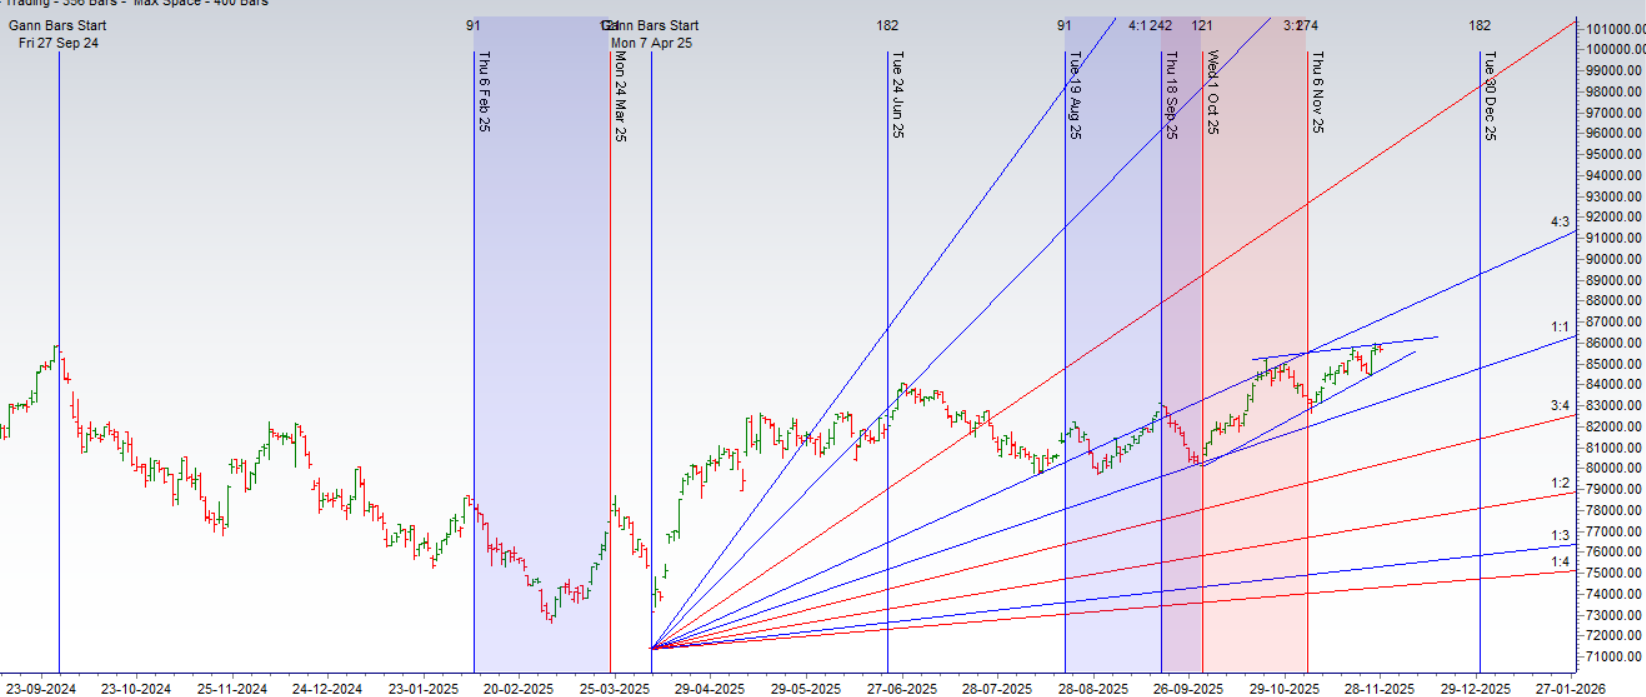
Sensex is between its 4×3 and 1×1 gann angle.
SENSEX Supply and Demand
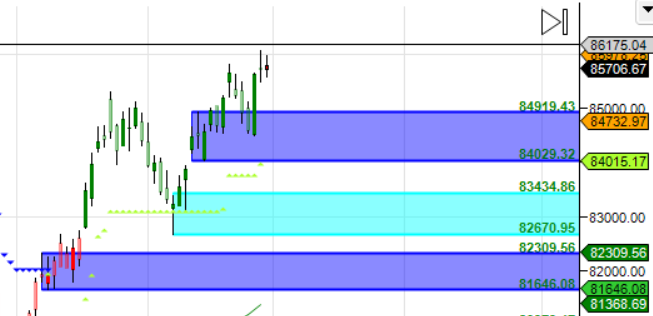
Self Explanatory Chart
SENSEX Time Analysis Pressure Dates
Key Pivot Dates: Watch 01/05 Dec
SENSEX Weekly Chart
Weekly Outside Bar
SENSEX Monthly Charts
87000 is Monthly resistance zone 83129 is Support zone.
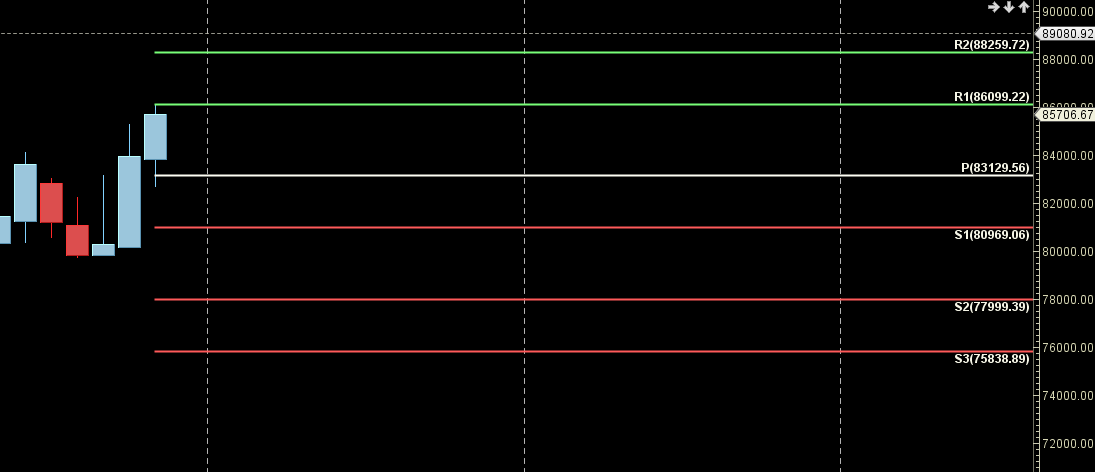
SENSEX Weekly Levels
SENSEX Trend Deciding Level: 86222
SENSEX Resistance: 86512,86803,87230,87522,87729
SENSEX Support: 85931,85640,85350,85059,84768
Levels mentioned are SENSEX Spot
Learn More:
W.D. Gann Trading Strategies – Learn how to decode markets using price, time, and geometry.
Trading Using Financial Astrology – Discover how planetary motion impacts market behavior and how to trade it effectively.
Ready to Trade Like a Time-Master?
Join our one-on-one mentorship to master astro-timing, Gann analysis, and institutional-grade setups.
Call: 09985711341
Email: bhandaribrahmesh@gmail.com