


A High-Stakes Standoff: FIIs Build a Bearish Wall as New Money Fuels the Conflict
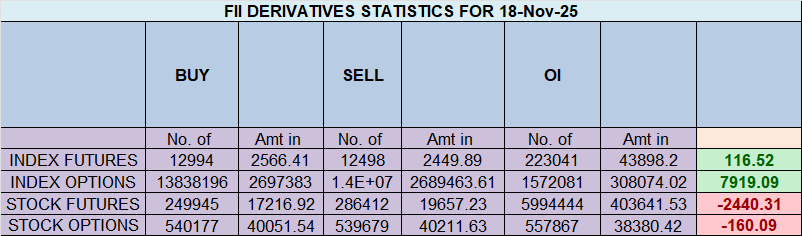
On November 18, 2025, the Nifty Index Futures market gave a subtle but powerful signal that a major battle is brewing beneath the surface. While the headline action from Foreign Institutional Investors (FIIs) appeared modest—a net short of just 619 contracts—the real story lies in the conviction behind the flows, confirmed by a crucial increase in net Open Interest (OI) of 623 contracts.
This is a classic signature of a market that is not consolidating peacefully, but is instead quietly coiling with new, high-conviction positions on opposite sides of a widening chasm of opinion.
Decoding the Data: Two Opposing Armies Dig In
The data reveals a stark and growing divergence between the market’s most powerful players and its retail participants.
1. The FII Bears: Methodically Selling into Strength
The FIIs’ action is a picture of cold, calculated, bearish conviction. They are not panicking; they are methodically distributing. By continuing to add new short positions, even as the market shows signs of strength, they are sending a clear signal: they believe the current rally is unsustainable and view these higher prices as a prime opportunity to sell. This has pushed their positioning to an extreme 12% long versus 88% short (ratio 0.13). This is not hedging; it is a massive, directional bet against the market.
2. The Client Bulls: The Unwavering Buyers
In a perfect mirror image, the retail clients are displaying peak optimism. They were significant net buyers, adding 747 new long contracts. Their activity shows a complete lack of fear, as they are confidently absorbing the supply offered by the institutions, believing the trend will continue upwards. Their positioning remains at a highly bullish 69% long versus 31% short (ratio 2.21), placing them in direct and total opposition to the FIIs.
3. The Most Critical Clue: The Rise in Open Interest
This is the key that unlocks the entire narrative. A rise in OI means that new capital has entered the market. It confirms that the standoff between FIIs and Clients is not just a shuffling of old positions, but a buildup of new, fresh bets. Both sides are so convicted in their opposing views that they are willing to put new money to work. This process of building OI during a period of divergence is like coiling a spring tighter and tighter. It builds potential energy in the system, ensuring that the eventual resolution will be powerful and decisive.
Key Implications
-
A Market at Maximum Divergence: The ideological and positional gap between institutions and retail is now at a historic extreme. This is an unstable and unsustainable market state.
-
A Bearish Wall is Being Built: The FIIs are methodically creating a supply ceiling above the market, which will act as a formidable resistance to any further rally.
-
The Trend is Nearing a Breaking Point: Rising OI confirms that the market is not trending peacefully but is building energy for its next major, high-velocity move. This is a sign of an impending breakout or breakdown, not consolidation.
-
High Risk of a Sharp Reversal: When positioning becomes this polarized, history shows that the eventual move tends to be against the retail crowd. The current setup is exceptionally dangerous for the longs, as a reversal could trigger a cascade of selling from this large, exposed group.
Conclusion
The surface calm of the Nifty is profoundly deceptive. Beneath it, a high-stakes conflict is escalating. FIIs are using the market’s strength to build a massive bearish fortress, while retail is confidently buying into it. The rising Open Interest is the definitive proof that this conflict is intensifying, not resolving. The market is now a powder keg, and a major, volatile resolution appears imminent.
Last Analysis can be read here
The Nifty market is teetering on the edge of a significant reversal after a failed, high-stakes assault on the crucial 26,000 resistance level. The session’s price action tells a story of bullish exhaustion and a powerful return of the bears, culminating in two critical technical warning signs: the formation of a bearish “Outside Bar” and a weak close below the weekly open of 25,946.
This technical weakness is now set to be amplified by a volatile astrological catalyst, creating a perfect storm for a potential trend reversal.
1. The Technical Breakdown: A Tale of Two Failures
The evidence for a bullish failure is now overwhelming and comes from two distinct sources:
-
The Outside Bar Reversal: This is a profoundly bearish signal. An “Outside Bar” is a sign of a violent sentiment shift where the market makes both a higher high and a lower low than the previous day, before closing near the lows. It demonstrates that the bulls attempted to break out, were decisively rejected, and were completely overwhelmed by sellers by the end of the session. It is the footprint of a bull trap.
-
The Weekly Failure: By closing below the weekly open of 25,946, the market has confirmed that the bears are in control of the week’s price action. This is not just an intraday reversal; it is a sign that the entire week’s bullish momentum has been negated, putting the sellers in a commanding position ahead of the crucial weekly close.
2. The Astrological Catalyst: Mercury Retrograde Enters Scorpio
Adding a powerful layer of chaotic and intense energy to this already fragile setup is today’s major astrological event: Mercury, already retrograde, is changing signs and moving into Scorpio.
This is not a gentle transit. Mercury in Scorpio is known for its intensity, probing nature, and a tendency to trigger sharp, decisive, and often ruthless market moves. In a retrograde phase, its disruptive potential is magnified. It is the perfect celestial trigger for a market that is already showing clear signs of technical weakness. It promises to inject the volatility needed to convert the current state of indecision into a decisive, directional downtrend.
3. The Intraday Game Plan: Capturing the Reversal Trend
Given the powerful confluence of bearish technical patterns and a volatile astrological signature, the strategy must be focused on identifying the confirmation of this new downtrend. The “First 15-Minute” rule is the ideal tool for this:
-
Establish the Initial Range: The first 15 minutes of trading will reveal the market’s immediate reaction. Will there be a weak attempt to recover, or will the bears press their advantage from the open? Mark the high and low of this critical period.
-
Trade the Confirmation of the Downtrend:
-
A break above the 15-minute high would represent an attempt to fight against the powerful bearish signals, a low-probability trade.
-
A decisive break below the 15-minute low is the high-probability confirmation signal. This would validate the bearish implications of the Outside Bar, confirm that the bears are in full control, and likely trigger the start of a sustained downtrend for the day.
-
Conclusion
The Nifty is in a perilous position. A major technical failure at a key resistance level has created a classic bearish reversal pattern. This setup is now being met with a potent astrological catalyst known for triggering sharp, volatile moves. The evidence is strongly aligned for a bearish continuation. Watch the 15-minute opening range with extreme focus, as a break of the low could be the starting gun for the market’s next significant downward move.
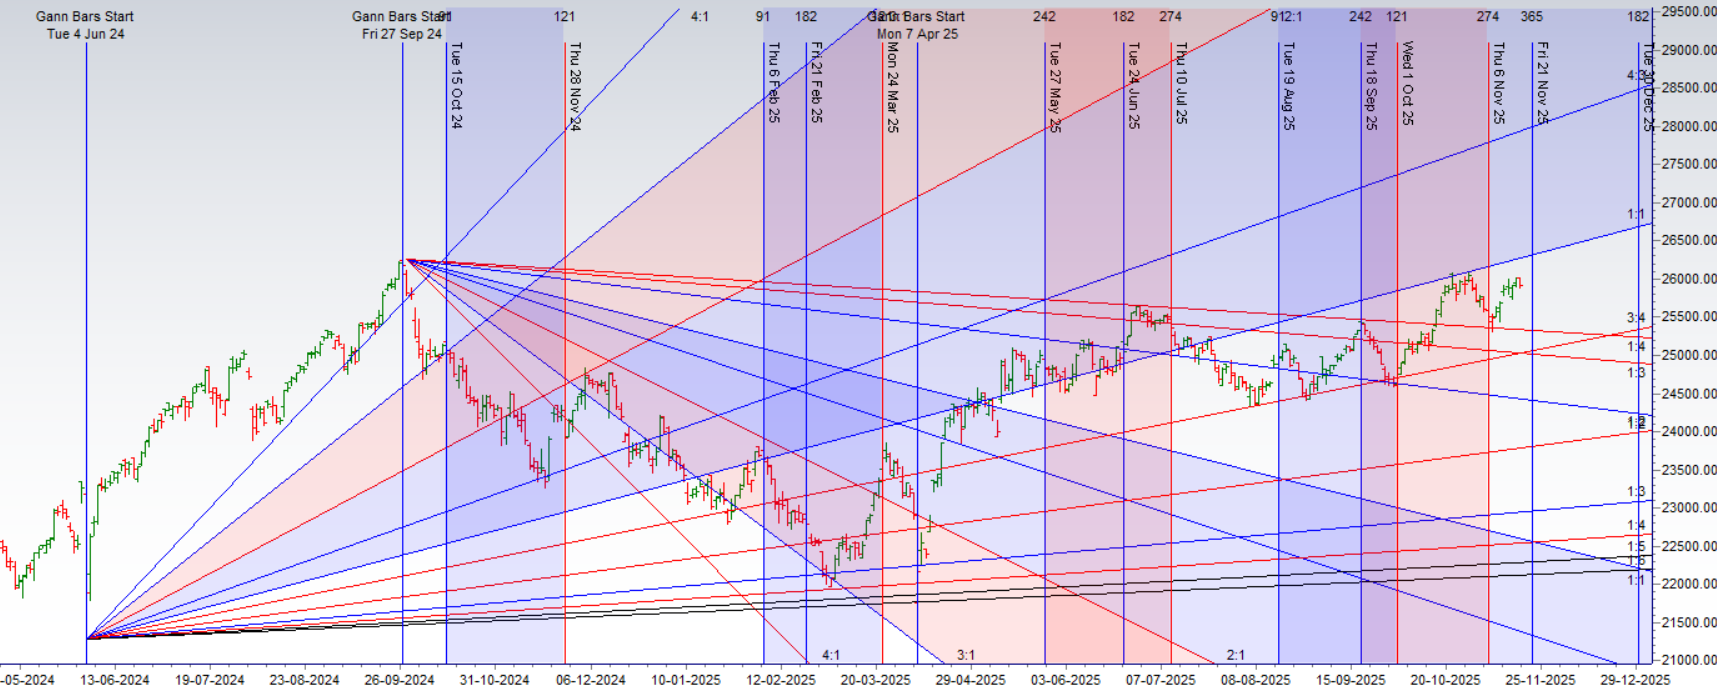
Nifty Trade Plan for Positional Trade ,Bulls will get active above 25927 for a move towards 26007/26087. Bears will get active below 25848 for a move towards 25768/25688
Traders may watch out for potential intraday reversals at 10:00,11:33,12:36,01:16,02:31 How to Find and Trade Intraday Reversal Times
Nifty Oct Futures Open Interest Volume stood at 1.76 lakh cr , witnessing liquidation of 4.5 Lakh contracts. Additionally, the increase in Cost of Carry implies that there was closuer of LONG positions today.
Nifty Advance Decline Ratio at 09:41 and Nifty Rollover Cost is @26104 closed below it.
In the cash segment, Foreign Institutional Investors (FII) sold 728 cr , while Domestic Institutional Investors (DII) bought 6156 cr.
A Shift in Command: Caution Returns to the Nifty as a Bearish Tilt Emerges
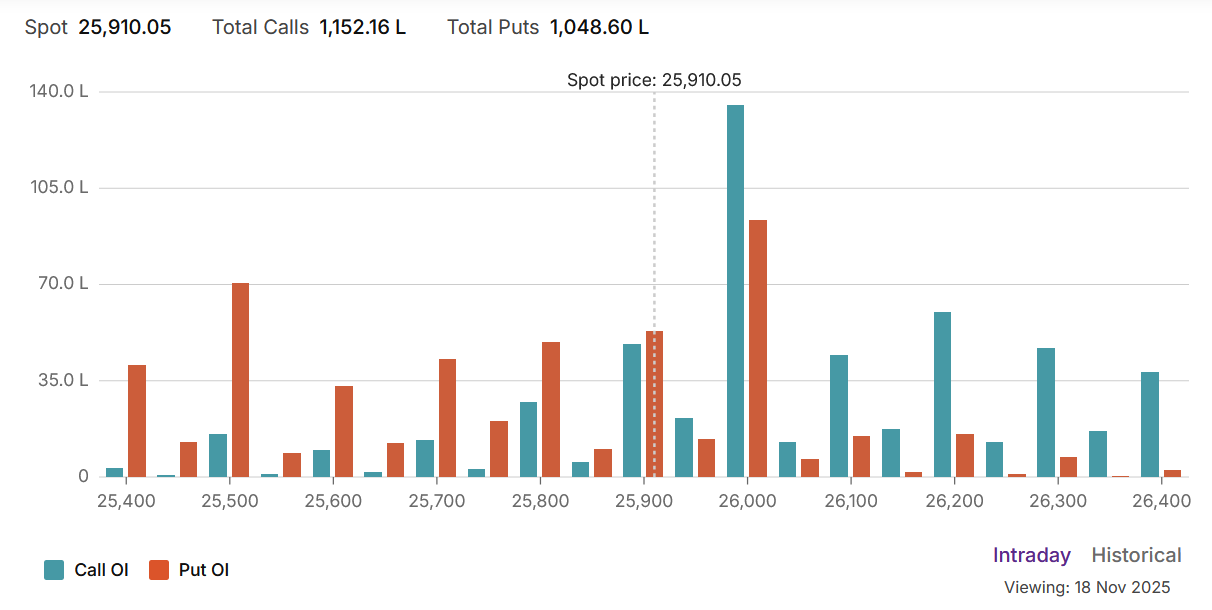
The Nifty options market is signaling a clear and decisive end to the recent bullish fervor, with sentiment now tilting firmly towards the bears. This is unequivocally captured by a Put-Call Ratio (PCR) that has deteriorated to 0.87, indicating that call writers have seized the initiative. The market is now caught in the gravitational pull of the Max Pain point at 25,950, which has become the central battleground in a new, more cautious trading environment where the upside momentum has been decisively checked.
The Psychology of a 0.87 PCR: The Return of Caution
The drop in the PCR to 0.87 is a significant development. While not a sign of outright panic, it represents a substantial retreat from the bullish confidence seen in previous sessions. A PCR below 1.0 means there is more open interest in call options than in put options, and a value slipping below 0.90 suggests that sellers are more active and confident in capping the market’s upside than in supporting its downside. This shift is driven by a surge in call writing—traders selling call options with the belief that the rally has stalled and key resistance levels will hold. The easy money for the bulls is over, and every point higher will now be a hard-fought battle.
The Market’s Fulcrum: Max Pain at 25,950
The Max Pain level at 25,950 has become the undeniable pivot for the market. This is the price point where the maximum number of option buyers (both bulls and bears) would incur the greatest financial loss at expiry, thus ensuring the maximum profit for the large institutional sellers. This level is now acting as a powerful magnet, pulling the index towards it and likely keeping it anchored in a tight range. Rallies are being sold, and dips are being bought, all with the implicit goal of keeping the market contained around this fulcrum of maximum financial pressure.
Defining the Battle Lines: Support and Resistance Levels
The current options data has carved out a very clear and well-defined battlefield:
-
Ultimate Resistance: An enormous and formidable wall of Call Open Interest stands at the 26,000 strike. This is the “Great Wall” for the Nifty, a level that will require immense and sustained buying pressure to overcome. It is the primary objective for bulls and the main line of defense for bears.
-
Immediate Resistance / Central Pivot: The 25,950 Max Pain level itself, encompassing the range up to 26,000, is the immediate and most critical battleground.
-
Major Support: The first significant floor of support is located at the 25,800 strike, where a substantial concentration of put writers has taken a stand.
-
Ultimate Support: The final line of defense and the ultimate floor for the current market structure is the massive wall of Put OI at the 25,500 strike. A break below this level would signal a major bearish victory and a significant market breakdown.
Conclusion
The market narrative has undergone a significant reversal. The bullish optimism has been replaced by a cautious, bearish-leaning consolidation. The market is now a prisoner of the options sellers, locked in a tight struggle defined by the strong support at 25,800 and the immense resistance at 26,000. The Max Pain at 25,950 will ensure that price action remains volatile and choppy within this range. The path of least resistance is now sideways to down, and a major external catalyst will be required to break the powerful stalemate that is currently in effect.
For Positional Traders, The Nifty Futures’ Trend Change Level is At 25899 . Going Long Or Short Above Or Below This Level Can Help Them Stay On The Same Side As Institutions, With A Higher Risk-reward Ratio. Intraday Traders Can Keep An Eye On 25971, Which Acts As An Intraday Trend Change Level.
Nifty Intraday Trading Levels
Buy Above 25900 Tgt 25927, 25963 and 26010 ( Nifty Spot Levels)
Sell Below 25864 Tgt 25824, 25800 and 25777 (Nifty Spot Levels)
Wishing you good health and trading success as always.As always, prioritize your health and trade with caution.
As always, it’s essential to closely monitor market movements and make informed decisions based on a well-thought-out trading plan and risk management strategy. Market conditions can change rapidly, and it’s crucial to be adaptable and cautious in your approach.
► Join Youtube channel : Click here
► Check out Gann Course Details: W.D. Gann Trading Strategies
► Check out Financial Astrology Course Details: Trading Using Financial Astrology
► Check out Gann Astro Indicators Details: Gann Astro Indicators
Aspect is not working sir .. can you guide why ?
plz read the latest post we explained in details