


Bank Nifty: Bears Press an Exhausted Market
On November 6, 2025, Foreign Institutional Investors (FIIs) continued their bearish campaign in the Bank Nifty Index Futures, but with noticeably less force. Their net short position increased by a modest 360 contracts, valued at ₹73 crore. While this action reaffirms their negative bias, the session’s more telling story, once again, comes from the Open Interest (OI) data.
The net Open Interest (OI) continued to decline, falling by 210 contracts. This confirms that the prevailing theme in the market is not one of new, aggressive positioning, but of position closure and participant exhaustion.
Decoding the Data: A Market Running on Fumes
This combination of light FII shorting and another drop in overall participation points to a market that is losing momentum, even as the bearish pressure persists. Let’s break down the dynamics:
-
FIIs: The Relentless Grind: The FIIs are still leaning on the short side. They are not covering their bearish bets, indicating they still see no reason to turn bullish. However, the relatively small size of their new shorts suggests a lack of urgency. Rather than an aggressive attack, their current action is more akin to maintaining pressure and defending their existing profitable positions.
-
Open Interest Decline: The Exodus Continues: The continued drop in OI signifies that the market is hollowing out. Traders are continuing to close their positions and move to the sidelines. This represents a mix of:
-
Final Bullish Capitulation: The last of the trapped bulls are likely using any minor intraday stability to exit their losing positions.
-
Early Bearish Profit-Taking: Some of the bears who entered at higher levels may be starting to take profits off the table, contributing to the OI decline.
-
When both the last of the bulls are giving up and the early bears are cashing out, it signals that a specific price swing or trend is nearing its conclusion.
Key Implications for Traders
-
Trend Exhaustion: A market that is declining on falling open interest is a sign of an exhausted trend. While the bearish pressure still exists, the “fuel” for a massive, continued collapse is diminishing because the pool of panicked longs left to sell is shrinking.
-
Increased Potential for a Sharp Reversal (Short-Squeeze): As more bears get on board and more bulls exit, the market becomes crowded on one side. A market in this state is highly susceptible to a “short-squeeze.” A sudden positive catalyst could force the large number of shorts to buy back their positions all at once, leading to a surprisingly sharp and violent rally.
-
The Grind Before the Turn: Before such a reversal, the market often enters a “grinding” phase, where price action is sluggish and indecisive. This reflects the lack of new participants and the waning conviction on both sides. The light FII activity and falling OI are classic symptoms of this phase.
-
A Market Awaiting a New Catalyst: With the old trend losing steam, the Bank Nifty is now in a sensitive state, waiting for a new catalyst—be it news, a technical break, or a cyclical turn—to ignite its next major directional move.
Conclusion
The data from this session suggests a transition is underway. The bearish trend has not been negated, but it is showing clear signs of exhaustion. The FIIs are maintaining a bearish lean, but the broader market is disengaging, signaling the end of the current momentum leg. While the immediate pressure remains downwards, traders should be on high alert for the potential of a sudden and sharp reversal. The Bank Nifty is becoming a coiled spring, and the risk of a violent counter-trend move is now significantly higher.
Bank Nifty Nov Futures Open Interest Volume stood at 18.4 lakh, with addition of 1 Lakh contracts. Additionally, the Increase in Cost of Carry implies that there was a addition of SHORT positions today.
Bank Nifty Advance Decline Ratio at 03:09 and Bank Nifty Rollover Cost is @58357 closed above it.
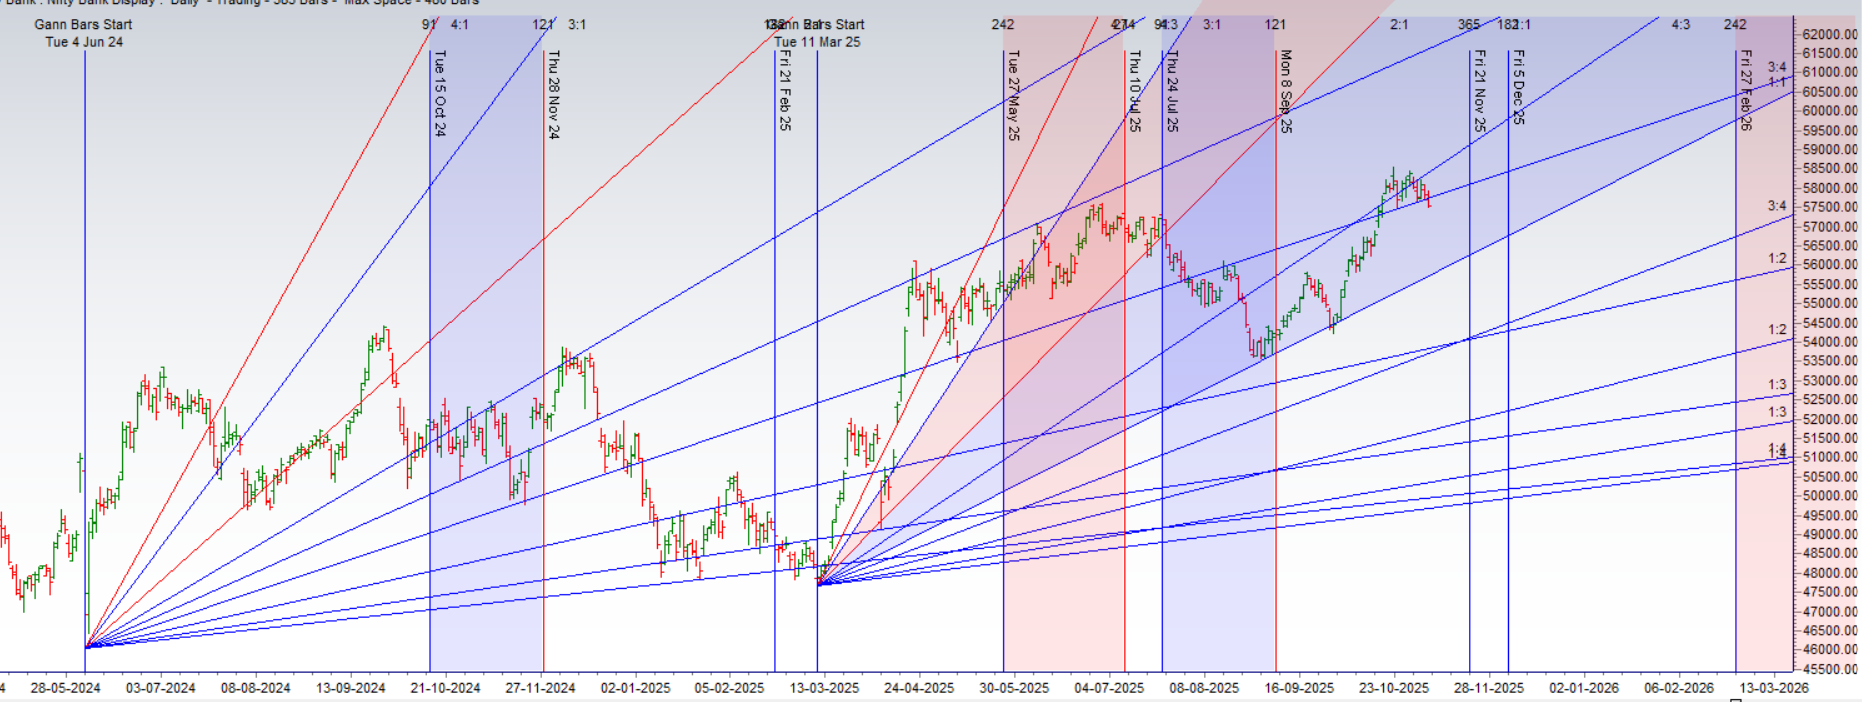
Bank Nifty Gann Dynamic Levels 56507-56984-57462-57943-58425
Bank Nifty Trapped in a Gravitational Field at 58,000
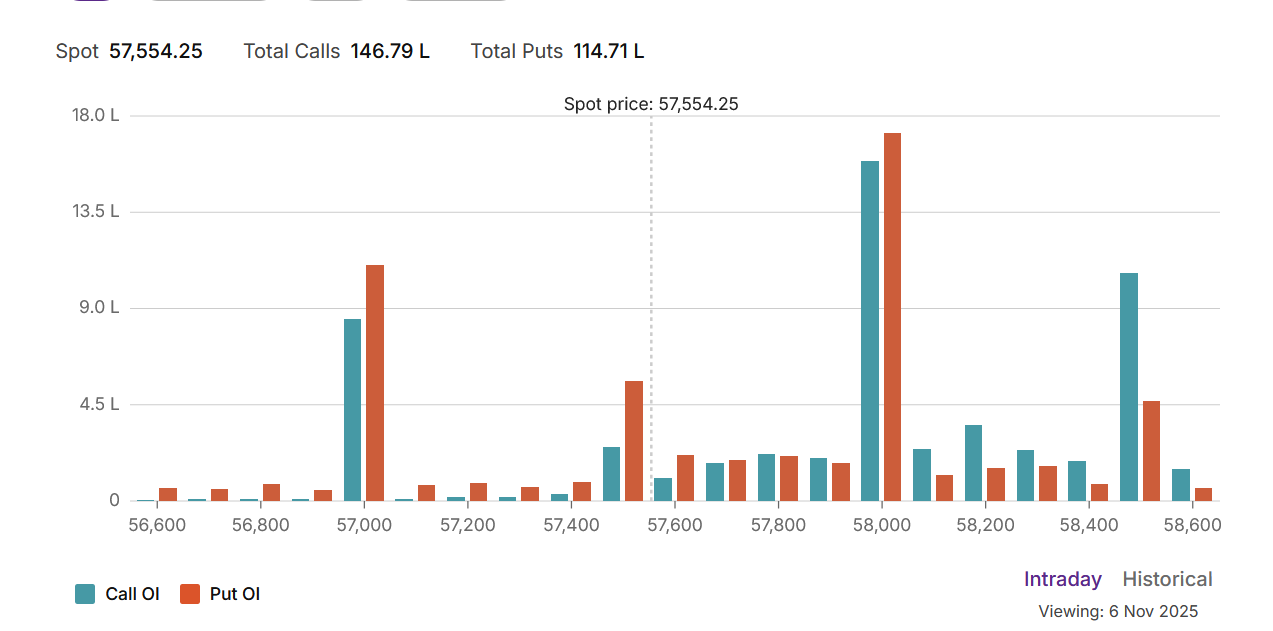
The Bank Nifty options market is painting a dramatic and unambiguous picture: the index is locked in an intense gravitational pull towards the 58,000 strike price. This level has become the undeniable epicenter of market activity, acting as a powerful magnet that is pinning the price and creating a state of high tension. The data suggests that powerful option writers have built a fortress around this strike, creating a “maximum pain” scenario for buyers on both sides of the market.
The Epicenter: The Massive Straddle at 58,000
A single glance at the Open Interest (OI) chart reveals a stunning sight. The skyline is dominated by the colossal “twin towers” of OI at the 58,000 strike. Here, both the Call OI ( teal bar, approx. 15.5 Lakh contracts) and the Put OI (orange bar, approx. 17 Lakh contracts) are immense, dwarfing all other strikes. This indicates that a massive number of traders have written (sold) both calls and puts at this level, a strategy known as a short straddle. They are making a powerful, high-stakes bet that the Bank Nifty will expire precisely at, or very close to, 58,000.
This visual evidence is perfectly confirmed by the calculated Max Pain level, which is also 58,000. This is the price point where the maximum number of option buyers lose their entire premium, ensuring the maximum possible profit for the sellers who built this straddle. The market’s natural tendency is to gravitate towards this point as expiry approaches.
Sentiment and Positioning: Cautious but not Panicked
The Put-Call Ratio (PCR) of 0.78 (derived from 114.71 L Puts / 146.79 L Calls) indicates that there are more open call positions than put positions in the system. While a PCR below 1.0 is technically bullish, a value of 0.78 is not indicative of strong conviction. Given the spot price of 57,554.25, a significant portion of the call OI is “out-of-the-money,” representing hope more than immediate strength. This PCR suggests an absence of significant fear, but it also reflects a market that is struggling to build sustainable upward momentum against the weight of the positions at higher strikes.
Defining the Battleground: Key Support and Resistance Levels
The OI data provides a clear map of the key levels traders are defending:
-
Ultimate Resistance and Pivot: 58,000. With nearly 16 Lakh calls written here, this level acts as both a price magnet and a formidable ceiling. A decisive move above this level would inflict immense pain on the call writers, potentially triggering a massive short squeeze.
-
Secondary Resistance: 58,500. This strike holds the next significant concentration of Call OI, marking the next major hurdle for the bulls should they manage to conquer the 58,000 fortress.
-
Immediate Support: 57,500. This level has the nearest significant concentration of Put OI below the current spot price. This is the first line of defense for the bulls.
-
Major Support: 57,000. This strike holds a very large wall of Put OI (approx. 11 Lakh contracts), making it the ultimate floor. A break below this level would signal a major bearish victory and likely lead to an accelerated decline.
Conclusion
The Bank Nifty is caught in a classic pinning scenario. The most probable outcome is a low-volatility grind, with the index remaining trapped in a range between 57,500 and 58,000 as the forces at the Max Pain level exert their influence. While the PCR shows a lack of outright panic, the overwhelming OI concentration at 58,000 makes a sustained directional move extremely difficult. The market is in a state of tense equilibrium, and it would likely take a major external catalyst to provide enough force to break the powerful gravitational pull of the 58,000 strike.
For Positional Traders, The Bank Nifty Futures’ Trend Change Level is At 58336 . Going Long Or Short Above Or Below This Level Can Help Them Stay On The Same Side As Institutions, With A Higher Risk-reward Ratio. Intraday Traders Can Keep An Eye On 57955, Which Acts As An Intraday Trend Change Level.
BANK Nifty Intraday Trading Levels
Buy Above 57630 Tgt 57729, 57825 and 58097 (BANK Nifty Spot Levels)
Sell Below 57500 Tgt 57400, 57250 and 57008 (BANK Nifty Spot Levels)
Wishing you good health and trading success as always.As always, prioritize your health and trade with caution.
As always, it’s essential to closely monitor market movements and make informed decisions based on a well-thought-out trading plan and risk management strategy. Market conditions can change rapidly, and it’s crucial to be adaptable and cautious in your approach.
► Join Youtube channel : Click here
► Check out Gann Course Details: W.D. Gann Trading Strategies
► Check out Financial Astrology Course Details: Trading Using Financial Astrology
► Check out Gann Astro Indicators Details: Gann Astro Indicators