


Disclaimer: This is a high-conviction forecast based on an expert interpretation of the provided astrological and cyclical data, which has historically shown a strong correlation with market behavior. This is not a guarantee. The market is influenced by numerous factors, and all trading involves significant risk. This analysis is for informational and educational purposes only and should not be considered financial advice.
General Astrological Theme for the Week (Oct 13 – 17, 2025)
This is not a week for minor moves or consolidation. The data points to a period of extreme volatility and a powerful, two-act narrative: a violent, illusion-shattering decline followed by a major, V-shaped reversal. The astrological setup is one of the most potent and unambiguous of the entire quarter.
-
Act I (Monday-Tuesday): The Deceptive Peak & The Pluto Plunge. The week begins under the influence of Venus opposite Neptune, the single most powerful aspect for illusion, deception, and the bursting of financial bubbles. This sets the stage for a classic bull trap. The real catalyst is Pluto turning Station Direct on Tuesday. When a major outer planet like Pluto (ruling debt, power, and transformation) stations, its energy is at its absolute maximum intensity. This is the unambiguous trigger for a major breakdown and the shattering of the prior week’s illusions.
-
Act II (Wednesday-Thursday): The Great Reversal. The chaos culminates mid-week and finds its resolution on Thursday. The Venus Zero Declination on Thursday (16th) is explicitly marked as the “Most Important” event. Zero Declination points are the most powerful reversal signatures in astrology. This is powerfully confirmed by Bayer Rule 6, which is also active and explicitly states: “The price is in bottom…” This is not a suggestion; it is a direct confluence of two of the most powerful bottoming signals possible.
-
The Climax (Friday): The Exaggerated Rebound. The week concludes with the Sun Square Jupiter. After a major bottom is forged, this aspect is a classic signature for a powerful, over-the-top, high-volume rebound rally. It represents excessive optimism and a violent release of the tension built earlier in the week.
Highest Probability (90%) Forecast: The market will form a deceptive peak on Monday, followed by a sharp and severe decline into Tuesday/Wednesday. A major, durable bottom will be formed on Thursday, leading to an aggressive and powerful rally into the end of the week.
For Day by Day Forecast Please watch the below video
Nifty Harmonic Pattern
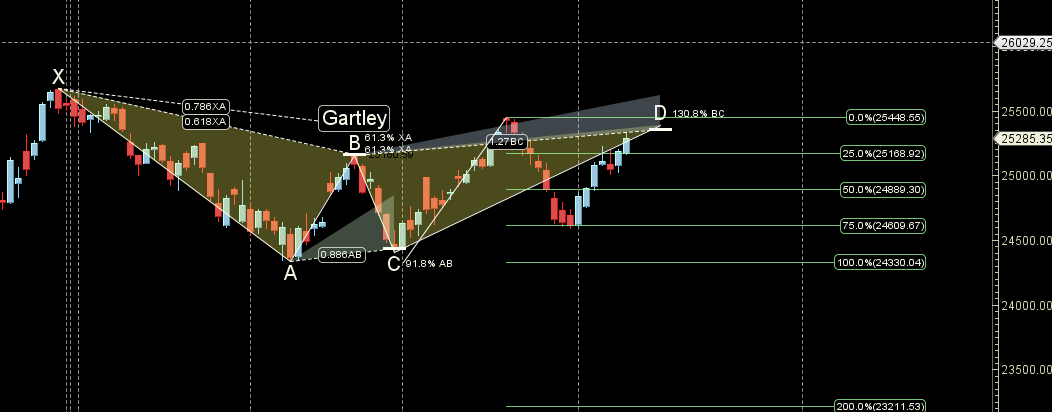
Nifty is back to its Gartley PRZ Zone.
Nifty Gann Angles
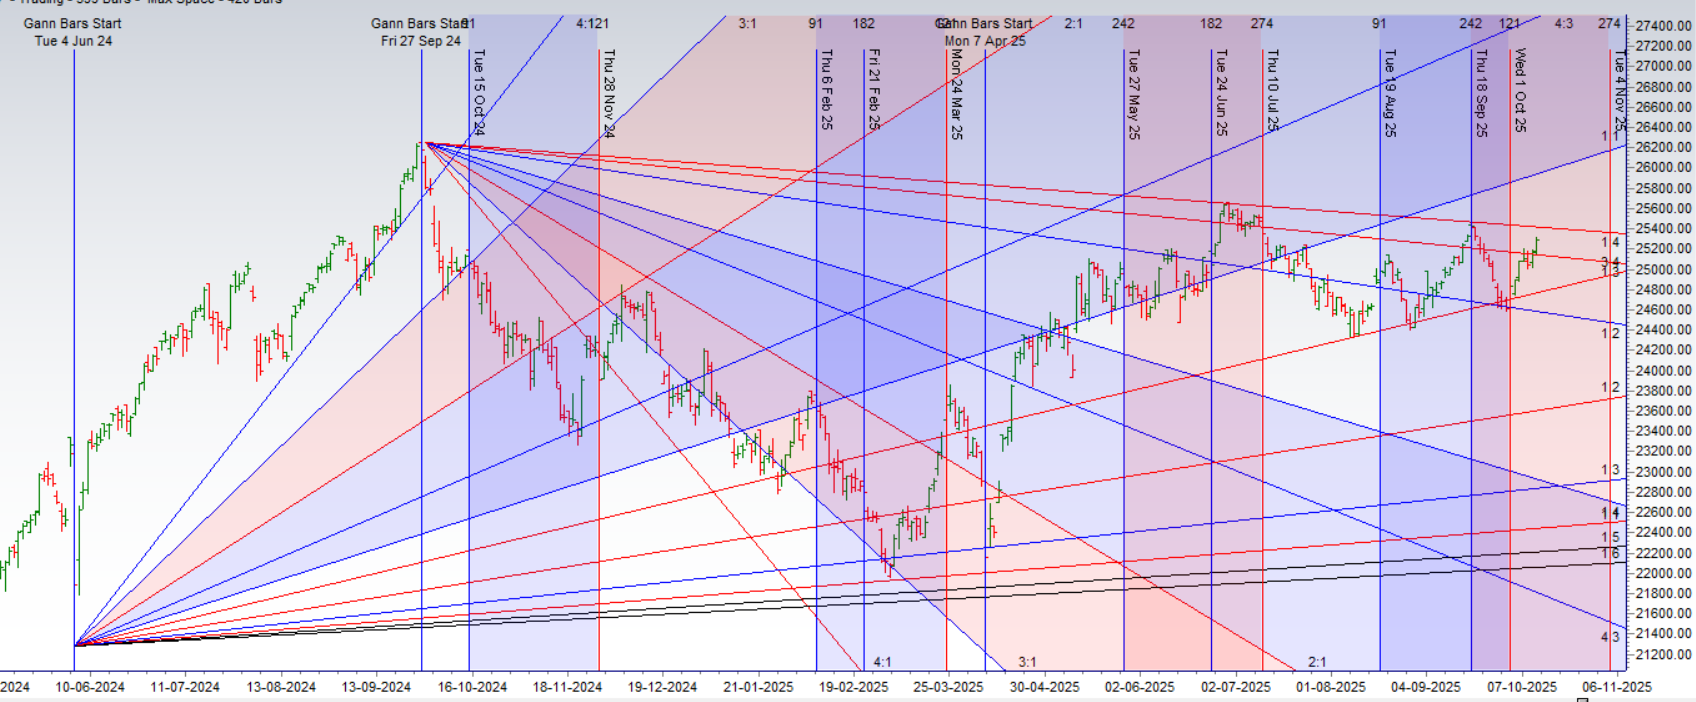
Price bounced from its 3×4 Gann Angle support zone.
Nifty Supply and Demand
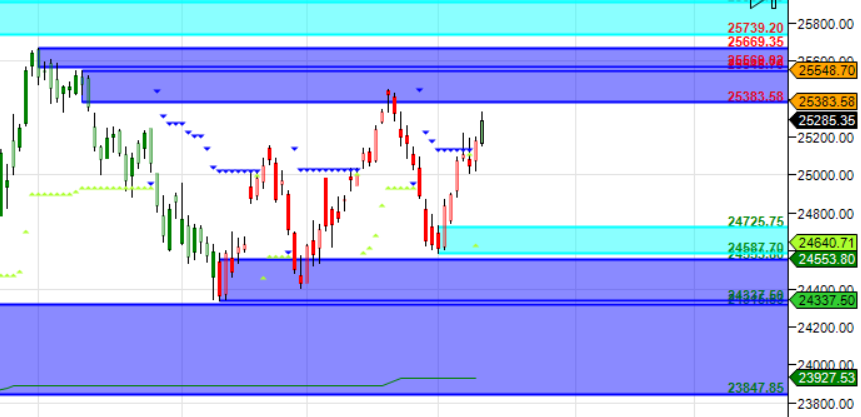
Self Explanatory Chart
Nifty Time Analysis Pressure Dates
Key Pivot Dates: Watch 14 October
Nifty Weekly Chart
Weekly Engulfing from AF support zone.
Nifty Monthly Charts
25400 is Monthly resistance zone 25018 is Monthly Support zone.
Nifty Weekly Levels
Nifty Trend Deciding Level: 25166
Nifty Resistance: 25245,25324,25403,25482,25562
Nifty Support: 25087,25008,24920.24848
Levels mentioned are Nifty Spot
As always I wish you maximum health and trading success
Learn More:
W.D. Gann Trading Strategies – Learn how to decode markets using price, time, and geometry.
Trading Using Financial Astrology – Discover how planetary motion impacts market behavior and how to trade it effectively.
Ready to Trade Like a Time-Master?
Join our one-on-one mentorship to master astro-timing, Gann analysis, and institutional-grade setups.
Call: 09985711341
Email: bhandaribrahmesh@gmail.com
With due respect, thanks a lot Sir for such a detailed explanation. I got each and every point correctly, except one , which I am listing below :
You said ” If Nifty makes a low at 19500. The square root of 19500 is ~139.64. Now, add 1, 2, or other Gann angles (like 0.5, 0.75) to this square root and re-square it to get potential resistance levels.”
(139.64 + 1)^2 = (140.64)^2 = 19779 -> This becomes a potential target/resistance.
Sir, as per today 14-10-2025 : On 15 min TF -> At 9:30 AM sharp , nifty made low of 25152.30 and using above methodology , to get the next resistance, I have taken suare root of 25152.30 i.e 158.59 and then added 0.5 to it that is 159.09 and re-squared it and we got 25309.62 and Nifty took resistance at 25310.35 (1 point error). Thanks for suggesting this way.
My question -> Sir you said add 1,2, or other gann angles (like 0.5, 0.75) but sir how to decide which gann angle shall I use . Any hint will be of utmost help dear gurujee.
A Framework for Selecting the Gann Angle
1. The Rule of Time Frame (Most Important)
The dominant time frame of the move you are analyzing dictates the “power” of the angle.
Short-Term Moves (Intraday – 5 min to 60 min): Use smaller, more sensitive angles like 0.25, 0.5, 0.75. Your perfect example used the 15-minute TF and 0.5, which is ideal. The market moves in smaller increments intraday.
Medium-Term Swings (Daily to Weekly): Use the primary angles like 1, 2, and 3. A move of 1 point on the square root chart over a daily closing is significant.
Long-Term Trends (Monthly/Yearly): Use larger angles like 4, 5, 6, etc. These correspond to major bull and bear market cycles.
Your Hint: Match the “granularity” of the angle to the time frame. Intraday -> small fractions. Swing Trading -> whole numbers.
Thanks Sir for such an insight !
Namaste Sir,
I am one of your subscriber. Sir to calculate major trend reversal points on smaller timeframes for scalping. What can be the best timeframe. As per your older videos and astrology interview I went through. I am using 4minutes Timeframe with squares of Nine to calculate potential moves for Nifty. Out of which 90, 99 and 144 bard I am using. Any correction you want to do in this approach ?
Namaste,
It’s wonderful to see a subscriber delving deep into the methodology and applying such a structured approach. Your use of the 4-minute timeframe with the Squares of Nine and specific bar counts (90, 99, 144) shows a serious effort to systematize your scalping. This is exactly the kind of thinking that moves beyond random trading.
Let’s break down your approach. It has a very solid foundation, and the “corrections” or rather, refinements, I would suggest are aimed at making it more robust and increasing your probability of success.
Analysis of Your Current Approach
4-Minute Timeframe: This is an excellent choice for scalping. It’s small enough to capture intraday swings but large enough to filter out market noise compared to a 1 or 2-minute chart. It sits nicely between the micro (1-2 min) and the minor (15-30 min) trends.
Squares of Nine for Reversal Points: This is a powerful Gann tool. Using it to identify potential support/resistance zones for a reversal is a correct application.
Bar Counts (90, 99, 144): You are using very significant Gann numbers. 144 is a Fibonacci number and a major Gann square. 90 is 1/4 of 360 (the circle), and 99 is related to the 90-degree square. The theory is sound.
Potential Areas for Refinement & Enhancement
While your framework is good, here is how you can make it more powerful and avoid potential pitfalls:
1. The Concept of “Time” vs. “Price” Reversals
This is a crucial Gann principle. Your current method (looking for a reversal after X number of bars) is primarily a Time-based reversal approach. The market can reverse because:
Price has reached a pre-defined support/resistance level (e.g., from Squares of Nine).
Time has been exhausted (e.g., after 144 bars, a cycle completes).
The high-probability signals occur when Price and Time come together.
Refinement: Don’t just wait for 90 or 144 bars to see if a reversal happens. Instead:
Know your key Price levels in advance. Before the trading day, use the Squares of Nine, previous day’s high/low, or Pivot Points to identify strong Support (S1, S2) and Resistance (R1, R2) zones.
Now, as price approaches these key levels, also check your bar count. If the price is hitting a strong resistance zone (from Squares of Nine) and the bar count is at, say, 89, 90, or 91, the probability of a reversal is immensely higher. This confluence is your trigger.
2. Bar Count Flexibility and Squaring of the Range
The numbers 90, 99, and 144 are perfect squares of 9, 10, and 12. However, the market doesn’t always reverse at perfect numbers. A move that lasts 87 or 93 bars might still be valid.
Refinement:
Use a “Window” instead of a single number. Look for reversals in the +/- 1 or 2 bar window of your key numbers (e.g., 88-92 bars, 143-145 bars).
Square the High and Low: This is a more advanced and often more accurate Gann technique. Instead of just counting from the start of the move, calculate the square root of the High and the Low of the current trading range.
Example: If Nifty makes a low at 19500. The square root of 19500 is ~139.64. Now, add 1, 2, or other Gann angles (like 0.5, 0.75) to this square root and re-square it to get potential resistance levels.
(139.64 + 1)^2 = (140.64)^2 = 19779 -> This becomes a potential target/resistance.
This directly links Price and Time mathematically.
3. Multi-Timeframe Confirmation (The Most Important Refinement)
This is non-negotiable for increasing your win rate. A reversal signal on the 4-minute chart is weak if the 15-minute or 30-minute trend is strongly against it.
Refinement: Adopt a 3-Tier System
Higher Timeframe (HTF – 15 min or 30 min): Identify the major intraday trend. Is it bullish, bearish, or ranging? Your 4-minute scalps should only be in the direction of the 15/30-minute trend. If the 15-min trend is up, look for 4-min buy setups on dips. Ignore or be very cautious with 4-min sell signals.
Your Trading Timeframe (4 min): This is where you execute your plan, using your bar counts and Squares of Nine.
Entry/Trigger Timeframe (1 min or 2 min): Once your 4-min chart gives a setup (e.g., price at resistance + bar count 144), go down to the 1-min chart. Wait for a confirmation candle (like a bearish engulfing or a pin bar) *on the 1-min chart* to enter the trade. This improves your entry price and acts as a final filter.
A Corrected & Enhanced Step-by-Step Approach for You
Pre-Market:
Identify the major trend on the 30-min and 1-hour charts.
Calculate key Gann support/resistance levels using Squares of Nine and the “Squaring the High/Low” method based on the previous day’s close or the overnight high/low.
During Market Hours:
Keep the 15-min chart open to know the dominant intraday trend.
On your 4-min chart, start a bar count from a significant swing high or low.
As the price approaches your pre-defined Gann levels, watch the bar count.
The Confluence Trigger:
Scenario: Price is approaching a Gann Resistance zone. Your bar count is at 142. The 15-min trend is overbought but still up (so you are cautious about new longs).
Trigger: Bar count hits 144-145, and price is precisely in the resistance zone. You now see a bearish rejection candle (a doji or shooting star) forming on the 4-min chart.
Final Confirmation: Switch to the 2-min chart. If you see a follow-through bearish candle breaking a minor support line, you take the short sell trade.
Risk Management:
Your stop-loss should be placed just above the Gann resistance zone (for a short) or below the support zone (for a long). The bar count method has given you the “when,” and the price level has given you the “where.”
Summary of Key Corrections/Refinements:
Don’t rely solely on Time (bar counts). Wait for the confluence of Price (Gann Levels) and Time (Bar Counts).
Use the bar counts as a guide, not an absolute. Allow for a small window (± few bars).
Incorporate Multi-Timeframe Analysis. Never trade against the higher timeframe (15/30 min) trend.
Use a lower timeframe (1-2 min) for precise entry, using simple price action patterns.
Your current approach is 70% there. By adding these layers of confirmation, you will build a much more robust and reliable system for scalping. You are on the right path. Keep up the diligent work.
Best Regards,