


Disclaimer: This is a high-conviction forecast based on an expert interpretation of the provided astrological and cyclical data, which has historically shown a strong correlation with market behavior. This is not a guarantee. The market is influenced by numerous factors, and all trading involves significant risk. This analysis is for informational and educational purposes only and should not be considered financial advice.
General Astrological Theme for the Week (Oct 13 – 17, 2025)
This is not a week for minor moves or consolidation. The data points to a period of extreme volatility and a powerful, two-act narrative: a violent, illusion-shattering decline followed by a major, V-shaped reversal. The astrological setup is one of the most potent and unambiguous of the entire quarter.
-
Act I (Monday-Tuesday): The Deceptive Peak & The Pluto Plunge. The week begins under the influence of Venus opposite Neptune, the single most powerful aspect for illusion, deception, and the bursting of financial bubbles. This sets the stage for a classic bull trap. The real catalyst is Pluto turning Station Direct on Tuesday. When a major outer planet like Pluto (ruling debt, power, and transformation) stations, its energy is at its absolute maximum intensity. This is the unambiguous trigger for a major breakdown and the shattering of the prior week’s illusions.
-
Act II (Wednesday-Thursday): The Great Reversal. The chaos culminates mid-week and finds its resolution on Thursday. The Venus Zero Declination on Thursday (16th) is explicitly marked as the “Most Important” event. Zero Declination points are the most powerful reversal signatures in astrology. This is powerfully confirmed by Bayer Rule 6, which is also active and explicitly states: “The price is in bottom…” This is not a suggestion; it is a direct confluence of two of the most powerful bottoming signals possible.
-
The Climax (Friday): The Exaggerated Rebound. The week concludes with the Sun Square Jupiter. After a major bottom is forged, this aspect is a classic signature for a powerful, over-the-top, high-volume rebound rally. It represents excessive optimism and a violent release of the tension built earlier in the week.
Highest Probability (90%) Forecast: The market will form a deceptive peak on Monday, followed by a sharp and severe decline into Tuesday/Wednesday. A major, durable bottom will be formed on Thursday, leading to an aggressive and powerful rally into the end of the week.
For Day by Day Forecast Please watch the below video
SENSEX Harmonic Pattern
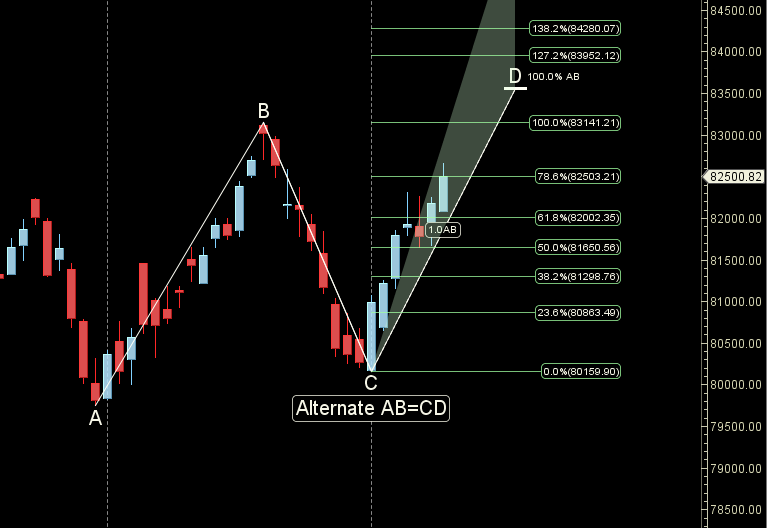
Sensex is heading back to its PRZ zone of 83141
SENSEX Gann Angles
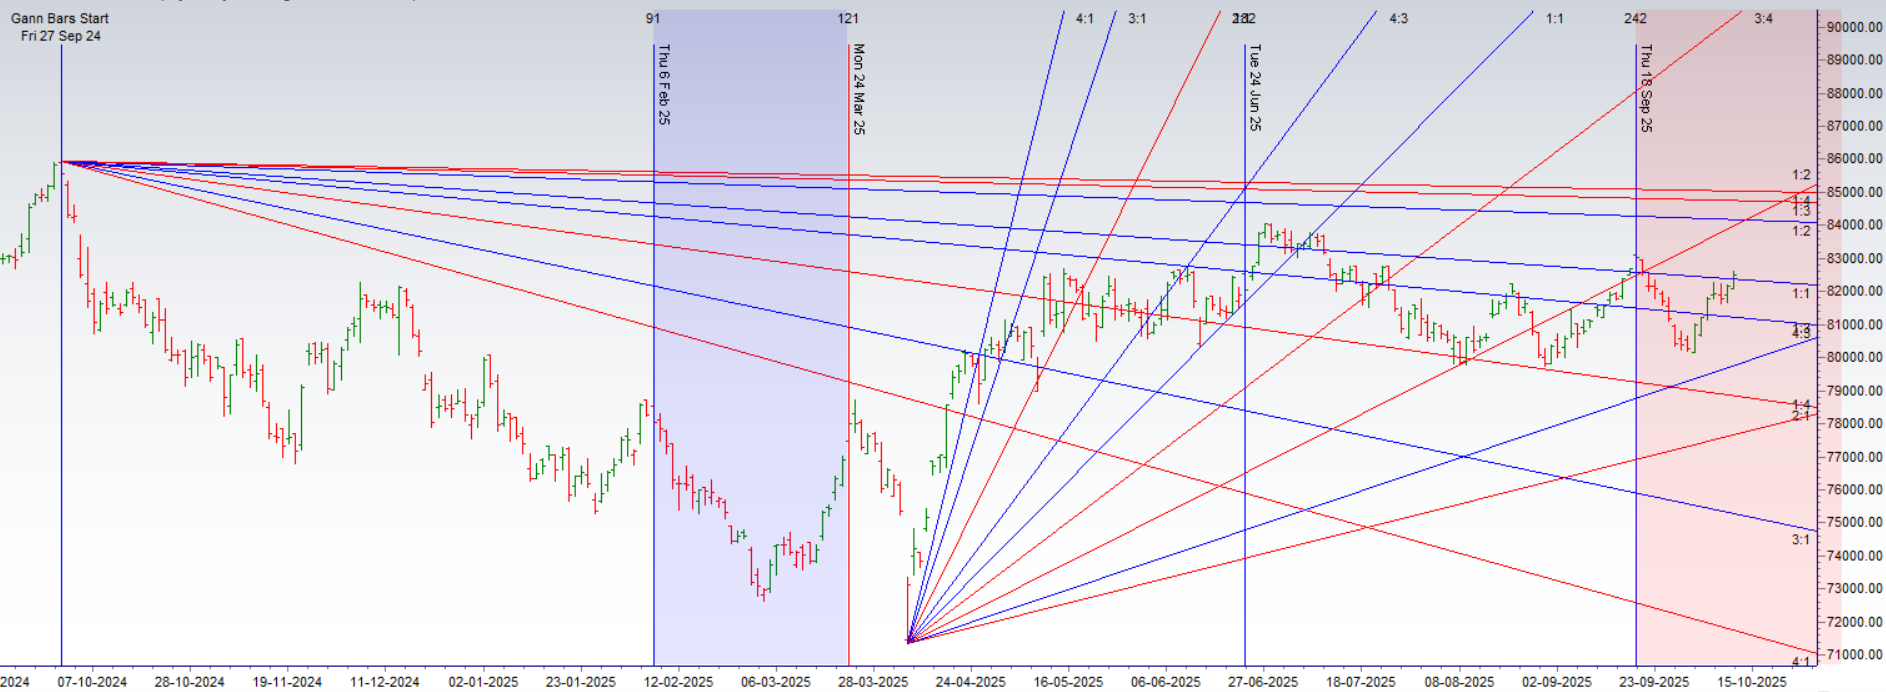
Sensex is heading to its 1×1 gann angle resistance zone.
SENSEX Supply and Demand
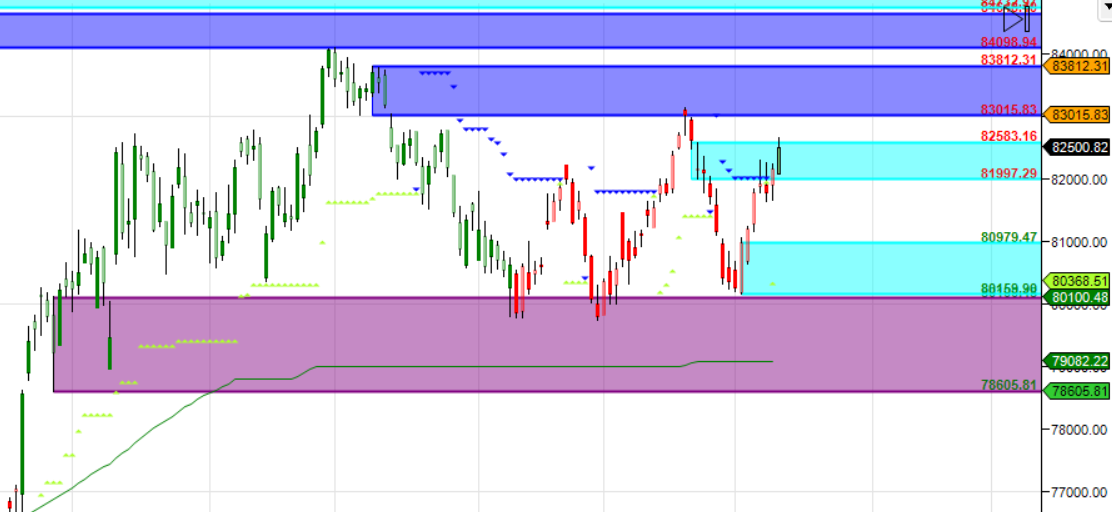
Self Explanatory Chart
SENSEX Time Analysis Pressure Dates
Key Pivot Dates: Watch 14 October
SENSEX Weekly Chart
Bullish Engulfing on Weekly Charts
SENSEX Monthly Charts
84398 is Monthly resistance zone 81075 is Support zone.
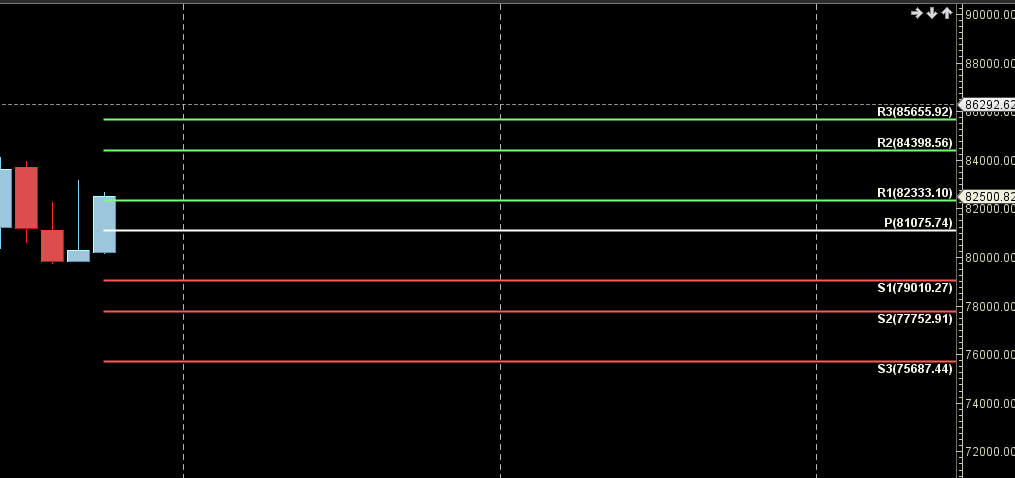
SENSEX Weekly Levels
SENSEX Trend Deciding Level: 82295
SENSEX Resistance: 82580,82865,83150,83434
SENSEX Support: 82010,81725,81440,81155
Levels mentioned are SENSEX Spot
Learn More:
W.D. Gann Trading Strategies – Learn how to decode markets using price, time, and geometry.
Trading Using Financial Astrology – Discover how planetary motion impacts market behavior and how to trade it effectively.
Ready to Trade Like a Time-Master?
Join our one-on-one mentorship to master astro-timing, Gann analysis, and institutional-grade setups.
Call: 09985711341
Email: bhandaribrahmesh@gmail.com