


Disclaimer: This forecast is based on an interpretation of the provided astrological and cycle data and its potential correlation with market behavior. It is for informational and educational purposes only and should not be considered financial advice. All trading involves significant risk.
General Astrological Theme for the Week
This is a “Pressure Cooker” week, defined by a rapid escalation of intense, volatile, and pivotal astrological events. The market is heading into a period of extreme stress and is primed for a major directional move. The narrative is clear:
-
The Pivot (Monday): The week begins with the Earth at its Equatorial Passage, a major reversal signature similar to a Zero Declination. This is a high-probability day for a significant market turn.
-
The Climax (Tuesday): A Full Moon coincides with a highly disruptive Mercury Square Pluto, explicitly marked as an “Important Turning Point.” This is the energetic climax of the week, suggesting a day of intense news, power struggles, and a potential for a sharp, decisive move.
-
The Amplification (Wednesday-Thursday): Volatility will be amplified by the Moon reaching Perigee (closest to Earth), followed by Pluto reaching its Extreme declination. These events will magnify the underlying market stress related to debt and power.
-
The Resolution (Friday): The week is set to conclude on a heavy and pessimistic note. The market will be trading under the direct influence of the upcoming Venus Opposition Saturn (occurring Saturday), a classic and powerful bearish aspect indicating financial restriction and a reality check.
The highest probability outcome is a week that starts with a significant high, followed by a sharp and sustained decline as the pressure builds, ending near the lows of the week.
For Day by Day Forecast Please watch the below video
SENSEX Harmonic Pattern
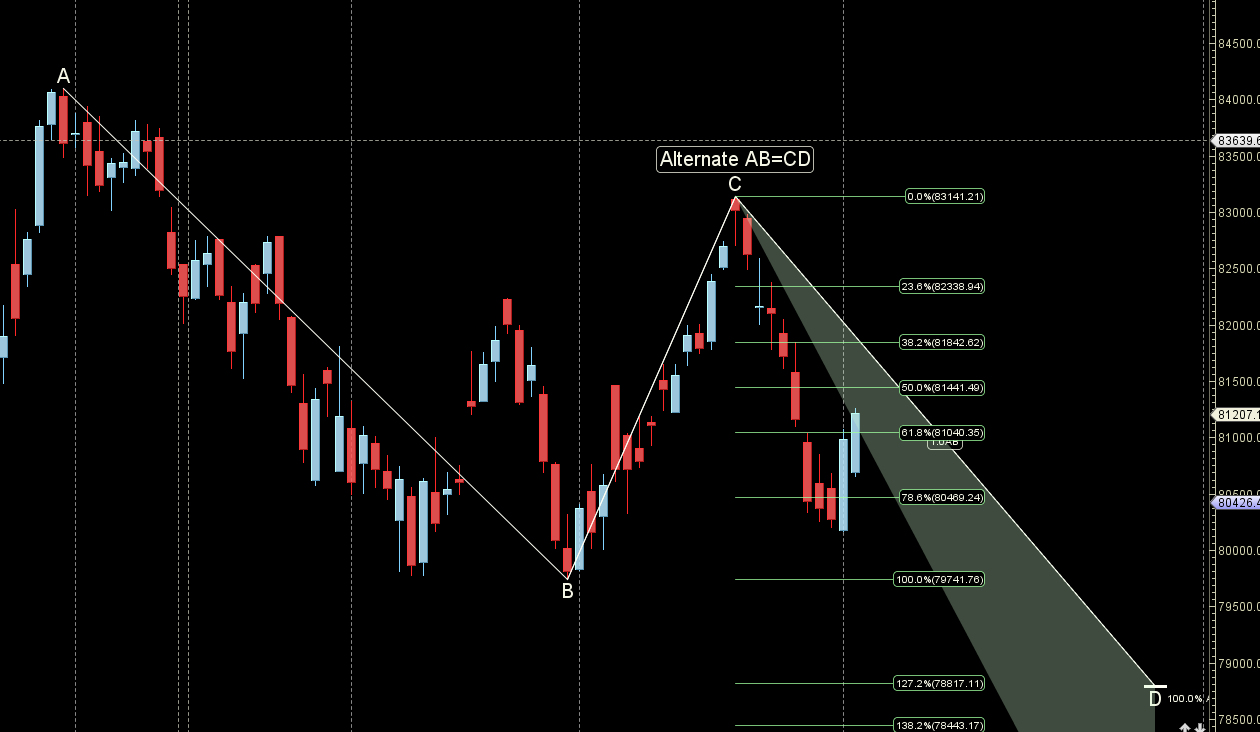
Sensex is heading back to octave point 0f 81441
SENSEX Gann Angles
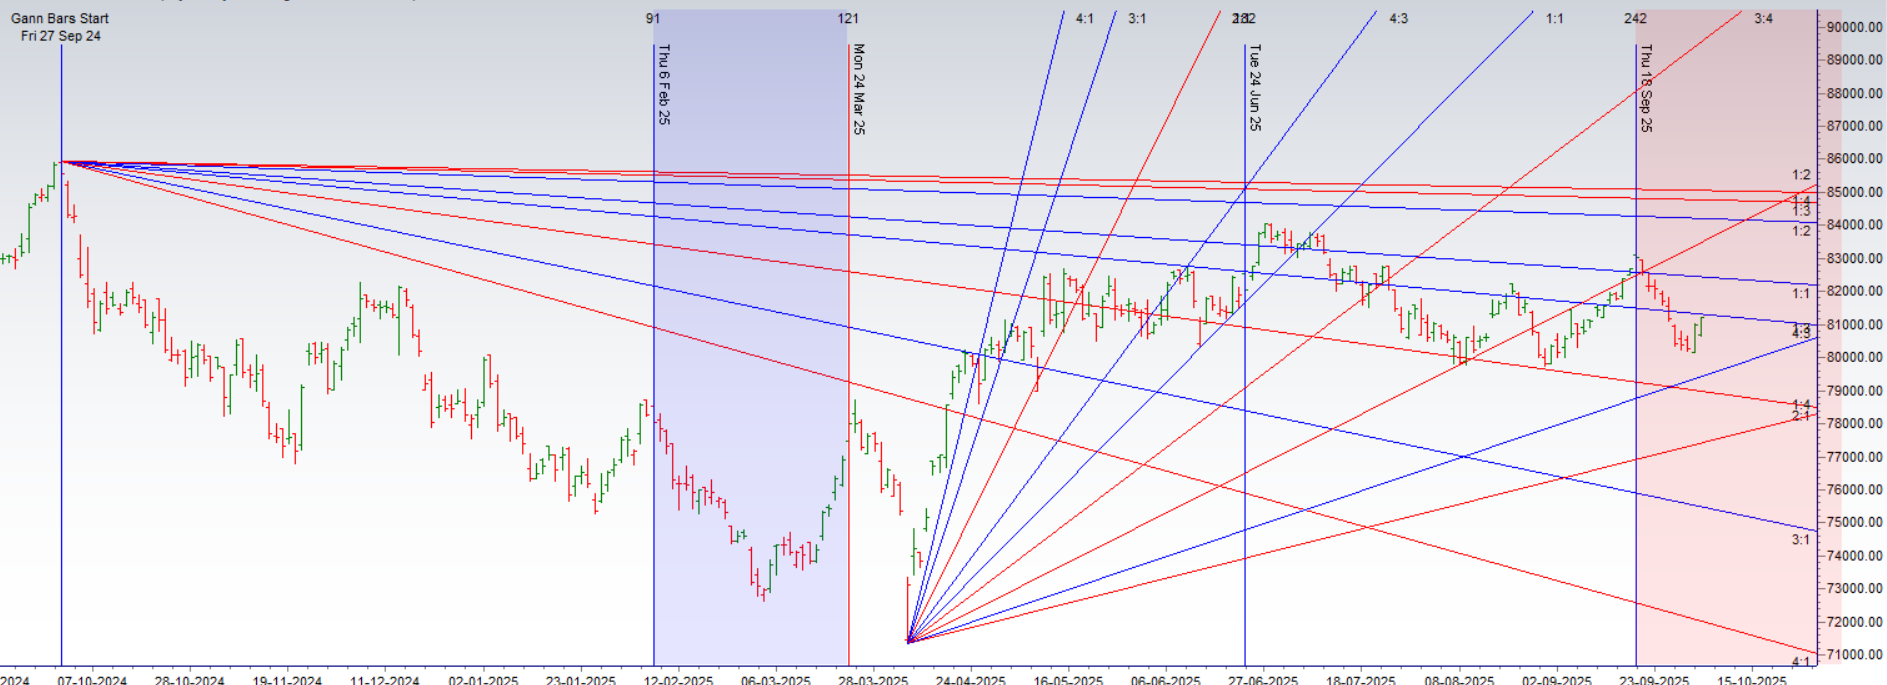
Sensex is heading to its 1×1 gann angle resistance zone.
SENSEX Supply and Demand
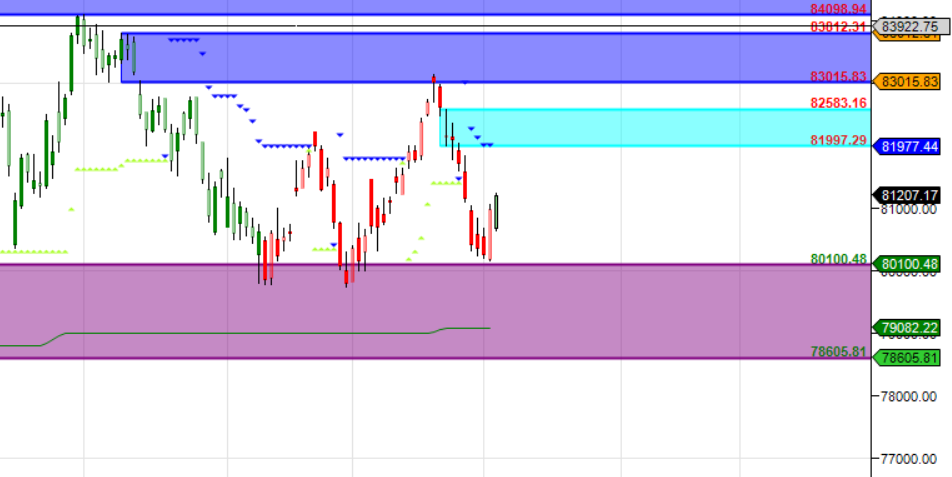
Self Explanatory Chart
SENSEX Time Analysis Pressure Dates
Key Pivot Dates: Watch 06 October
SENSEX Weekly Chart
Bullish Hammer on Weekly Charts
SENSEX Monthly Charts
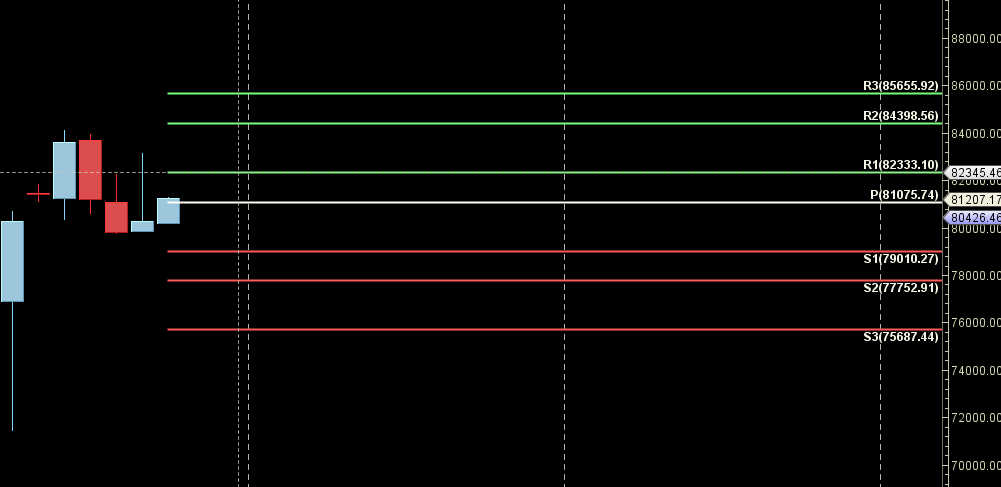
82333 is Monthly resistance zone 81075 is Support zone.
SENSEX Weekly Levels
SENSEX Trend Deciding Level: 81292
SENSEX Resistance: 81575,81858,82141,82424
SENSEX Support: 81009,80726,80443,80159
Levels mentioned are SENSEX Spot
Learn More:
W.D. Gann Trading Strategies – Learn how to decode markets using price, time, and geometry.
Trading Using Financial Astrology – Discover how planetary motion impacts market behavior and how to trade it effectively.
Ready to Trade Like a Time-Master?
Join our one-on-one mentorship to master astro-timing, Gann analysis, and institutional-grade setups.
Call: 09985711341
Email: bhandaribrahmesh@gmail.com