


A Strategic Retreat: FIIs Unload Long Positions, Luring Retail into a Bearish Trap
On the surface, the data for September 19, 2025, shows a clear bearish day for Foreign Institutional Investors (FIIs), who net shorted 2,697 contracts worth a substantial ₹517 crores. However, the real story, and the far more alarming signal, lies beneath this headline figure. The simultaneous decrease in net open interest by 2,279 contracts reveals that this was not a day of simple short-selling; it was a day of strategic de-risking and bullish capitulation by the smart money.
The Anatomy of the Bearish Signal
The breakdown of FII activity is exceptionally telling. While they did add 783 new short contracts, reinforcing their bearish bias, the far more significant action was the covering of a massive 2,331 long contracts. This is a powerful signal. It means the FIIs are actively abandoning their remaining bullish positions. They are no longer holding out for a potential rally; instead, they are liquidating their longs, likely viewing any minor strength as a final opportunity to exit before a potential decline. This is not just a bearish bet; it’s a vote of no-confidence in the market’s upside potential.
Retail Takes the Bait, Becoming the Counterparty
In a classic and dangerous market dynamic, the Client (retail) segment acted as the direct counterparty to the FIIs’ strategic exit. As FIIs were aggressively selling their long positions, retail traders were eagerly buying them, adding a colossal 3,763 fresh long contracts. This is a textbook case of “weak hands” absorbing the supply from “strong hands.” Retail is chasing the market and building up bullish exposure at the very moment that institutional players are de-risking and increasing their bearish bets.
The Deepening, Perilous Divergence
This activity has further widened the already perilous gap in positioning between the two groups. The FIIs’ Long/Short ratio remains at an extremely pessimistic 0.14, meaning their strategic stance is 87% short and only 13% long. Their actions today have only solidified this conviction by removing their remaining bullish hedges.
Conversely, the Client segment’s positioning is now a highly optimistic 2.42, or 71% long. This creates a profoundly unstable market structure. The FIIs are overwhelmingly positioned for a decline, while the retail crowd is heavily leveraged for a rally. History has shown that such extreme divergences rarely resolve in favor of the retail segment. The large and growing pool of vulnerable retail longs provides the very fuel needed for a sharp downward move, as any breach of key support levels could trigger a cascade of stop-losses and forced selling.
Conclusion
The net shorting figure on September 19th understates the severity of the bearish signal. The primary takeaway is the FIIs’ active liquidation of their long positions—a clear act of bullish capitulation. They have passed these vulnerable positions on to the retail segment, which has eagerly taken the other side of the trade. The market is now more structurally imbalanced and vulnerable to a significant decline than it was before. The trap has been set, and the risk is heavily skewed to the downside.
Last Analysis can be read here
The Nifty is now operating under the shadow of a powerful and historically significant celestial event: the Solar Eclipse. As discussed in your recent analysis, Solar Eclipses are not just astronomical occurrences; they have a high correlation with the emergence of major, often bearish, news events that can act as catalysts for significant market trends.
History provides a clear and compelling precedent. The market has repeatedly witnessed this pattern where a Solar Eclipse acts as a magnet for market-moving, negative headlines. A prime example, as you noted, was the sudden escalation of the trade war under the “Trump tariff” announcement, which coincided with a previous eclipse and triggered a significant market correction.
Today, we are seeing this historical pattern repeat with chilling precision. The bearish news catalyst delivered under the influence of this Solar Eclipse is the Trump H1B order. This is a direct and potent threat to the Indian IT sector, a heavyweight component of the Nifty. The uncertainty and potential negative impact on the earnings and growth of this crucial sector provide the perfect bearish narrative for the market to latch onto.
What elevates this from a standard news-driven event to a potentially explosive market move is the powerful amplifying effect of Martian energy. The eclipse’s influence is being magnified by a simultaneous Mars Ingress. In astrology, Mars is the planet of action, aggression, conflict, and sudden force. An ingress, where Mars changes signs, unleashes a new, raw, and often impulsive expression of this energy into the market.
Furthermore, this entire year is a “Year of Mars,” a broader theme that gives any Mars-related event, like this ingress, an extraordinary level of power and influence.
When we combine these factors, the outlook becomes exceptionally clear and potent:
-
The Eclipse Pattern: A historically reliable signal for a bearish news event is active.
-
The Bearish Catalyst: The H1B order has been delivered, providing the specific negative news.
-
The Aggressive Amplifier: A Mars Ingress, supercharged by the “Year of Mars,” is adding force, speed, and aggression to the market’s reaction.
Therefore, the expectation is not just for a simple decline. The confluence of these powerful forces suggests that we are likely to see an aggressive, swift, and decisive move in the Nifty. The market has been given both a reason (H1B news) and the energetic fuel (Mars) to initiate a significant trend, and all signals point to that trend being to the downside.
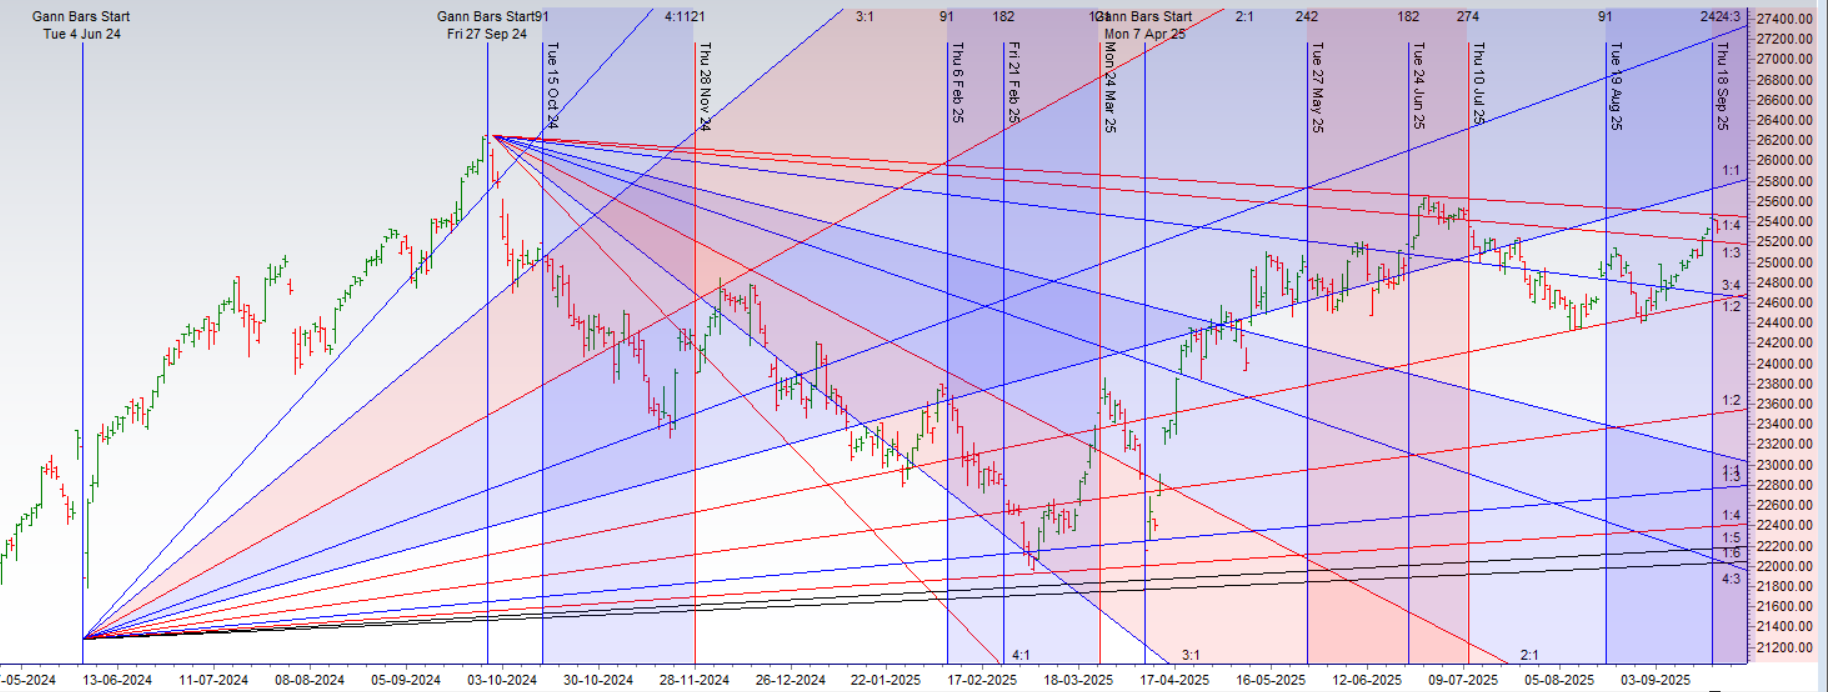
Nifty Trade Plan for Positional Trade ,Bulls will get active above 25350 for a move towards 25467/25549. Bears will get active below 25230 for a move towards25151/25072
Traders may watch out for potential intraday reversals at 09:58,10:52,12:46,01:29,02:21 How to Find and Trade Intraday Reversal Times
Nifty Sep Futures Open Interest Volume stood at 1.50 lakh cr , witnessing liquidation of 5.1 Lakh contracts. Additionally, the increase in Cost of Carry implies that there was closeure of SHORT positions today.
Nifty Advance Decline Ratio at 19:31 and Nifty Rollover Cost is @24980 closed above it.
Nifty Gann Monthly Trend Change level 24678 closed above it.
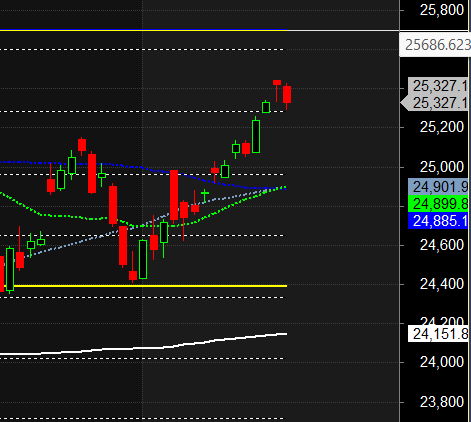
Nifty has closed above its 50 SMA @ 24900 Trend is Buy on Dips till above 25200
The Put-Call Ratio (PCR) stands at a bullish 0.82. A PCR this far below 1.0 indicates that Call option activity is significantly outpacing Put activity, signaling widespread optimism and a general lack of fear regarding a potential market decline. The market’s current pivot point is the Max Pain level at 25300, which will act as a crucial support base.
The Retail Position: Aggressive and Confident
Retail traders have thrown their weight firmly behind the bulls. Their most significant action was in the Call options, where they were substantial net buyers, establishing a net long position of nearly 94,000 contracts. This is an aggressive and leveraged bet on a continued market advance, showing a high degree of confidence that the Nifty will break through immediate resistance levels.
Their activity in the Put options, while less pronounced, reinforces this conviction. They were net buyers of Puts, but in much smaller quantities compared to their Call buying. This suggests minor hedging activity rather than a genuine fear of a downturn. The overwhelming narrative from the retail segment is one of strong bullish conviction.
The FII Strategy: A Professional Hedge
Crucially, the “smart money” is in agreement. The FIIs have also positioned themselves for Hedge of their shorts. They were net buyers of Call options, adding a net 22,000 long contracts.
Even more telling was their activity in the Put options. The FIIs were net sellers of Puts. This is a high-conviction, subtly bullish strategy. By selling Puts, FIIs are effectively acting as the “insurance house,” collecting premium with the strong belief that the market’s downside is limited and well-protected. It signifies they are comfortable taking on the obligation to be buyers at lower levels, which helps to establish a firm floor under the market.
Option Chain Support and Resistance
This unified bullish positioning carves out clear levels on the option chain:
-
Support: A formidable support base has been established. The heavy Put writing, especially from FIIs, combined with the Max Pain level, creates a powerful floor. The highest concentration of Put open interest is now located at 25300 and 25200, making this zone the primary support for the market.
-
Resistance: With both segments buying Calls, the primary resistance will be found at the strikes with the highest concentration of existing Call open interest. The logical targets and the next major supply walls are located at 25400 and 25500.
In the cash segment, Foreign Institutional Investors (FII) bought 366 cr , while Domestic Institutional Investors (DII) bought 3326 cr.
Traders who follow the musical octave trading path may find valuable insights in predicting Nifty’s movements. According to this path, Nifty may follow a path of 23037-23722-24408-25134-25860 This means that traders can take a position and potentially ride the move as Nifty moves through these levels.Of course, it’s important to keep in mind that trading is inherently risky and market movements can be unpredictable.

For Positional Traders, The Nifty Futures’ Trend Change Level is At 25017. Going Long Or Short Above Or Below This Level Can Help Them Stay On The Same Side As Institutions, With A Higher Risk-reward Ratio. Intraday Traders Can Keep An Eye On 25401 , Which Acts As An Intraday Trend Change Level.
Nifty Intraday Trading Levels
Buy Above 25265 Tgt 25300, 25337 and 25385 ( Nifty Spot Levels)
Sell Below 25230 Tgt 25200, 25166 and 25108 (Nifty Spot Levels)
Wishing you good health and trading success as always.As always, prioritize your health and trade with caution.
As always, it’s essential to closely monitor market movements and make informed decisions based on a well-thought-out trading plan and risk management strategy. Market conditions can change rapidly, and it’s crucial to be adaptable and cautious in your approach.
► Join Youtube channel : Click here
► Check out Gann Course Details: W.D. Gann Trading Strategies
► Check out Financial Astrology Course Details: Trading Using Financial Astrology
► Check out Gann Astro Indicators Details: Gann Astro Indicators