FIIs’ Minor Buying in Bank Nifty Masks a Larger Bearish Retreat
On the trading session of September 12, 2025, the activity of Foreign Institutional Investors (FIIs) in the Bank Nifty Index Futures presented a classic case where the headline data could be dangerously misleading. While FIIs were recorded as net buyers of 355 contracts, with a notional value of ₹68 crores, this seemingly bullish action is completely re-contextualized by the more significant drop in net open interest (OI), which fell by 873 contracts.
This divergence between net buying and a decrease in open interest is the textbook definition of short covering. It unveils a strategic retreat by the FIIs rather than a new vote of confidence in the banking sector.
Decoding the Data: Profit-Taking, Not New Longs
Here is what the data signifies: the buying activity was not driven by FIIs initiating fresh bullish positions. Instead, it was overwhelmingly dominated by FIIs closing out their existing short (bearish) positions. When a trader covers a short, they must buy back the contracts they previously sold. This action reduces the total number of open contracts in the market, leading to a decrease in open interest.
The fact that the OI decrease (-873 contracts) was more than double the net buying figure (+355 contracts) indicates that the primary activity was the squaring off of bearish bets. The FIIs were taking profits on their successful shorts, likely triggered by the market hitting a key support level or a pre-determined price target.
Implications for the Market:
A Deceptive Relief Rally: The buying pressure generated by this short covering can fuel a sharp, but often unsustainable, “relief rally.” Retail traders who only see the net buying figure can be easily lured into this bounce, mistaking it for the beginning of a genuine trend reversal. In reality, the fuel for this rally is the exit of bears, not the entry of new bulls.
No Change in Underlying Bearish Sentiment: This action does not signal that the FIIs have turned bullish on the Bank Nifty. It simply means they have successfully profited from a recent downward or sideways move. It is a tactical maneuver to lock in gains. Very often, sophisticated players will cover shorts at support and then look to re-initiate new short positions if the relief rally extends to a significant resistance level.
Weakness May Persist: Since the rally is not supported by new, optimistic capital, it is inherently fragile. Once the short-covering impulse is exhausted, the market may be vulnerable to a fresh wave of selling, as the underlying reasons for the initial bearishness may still be in place.
Conclusion:
Traders should not interpret the FIIs’ net buying on September 12th as a bullish signal for the Bank Nifty. The significant drop in open interest is the dominant and more truthful indicator, pointing directly to a session of short covering and profit-taking. The prudent approach is to view any resulting price rally with suspicion and to wait for evidence of genuine long buildup (i.e., buying accompanied by a rise in open interest) before turning optimistic on the sector.
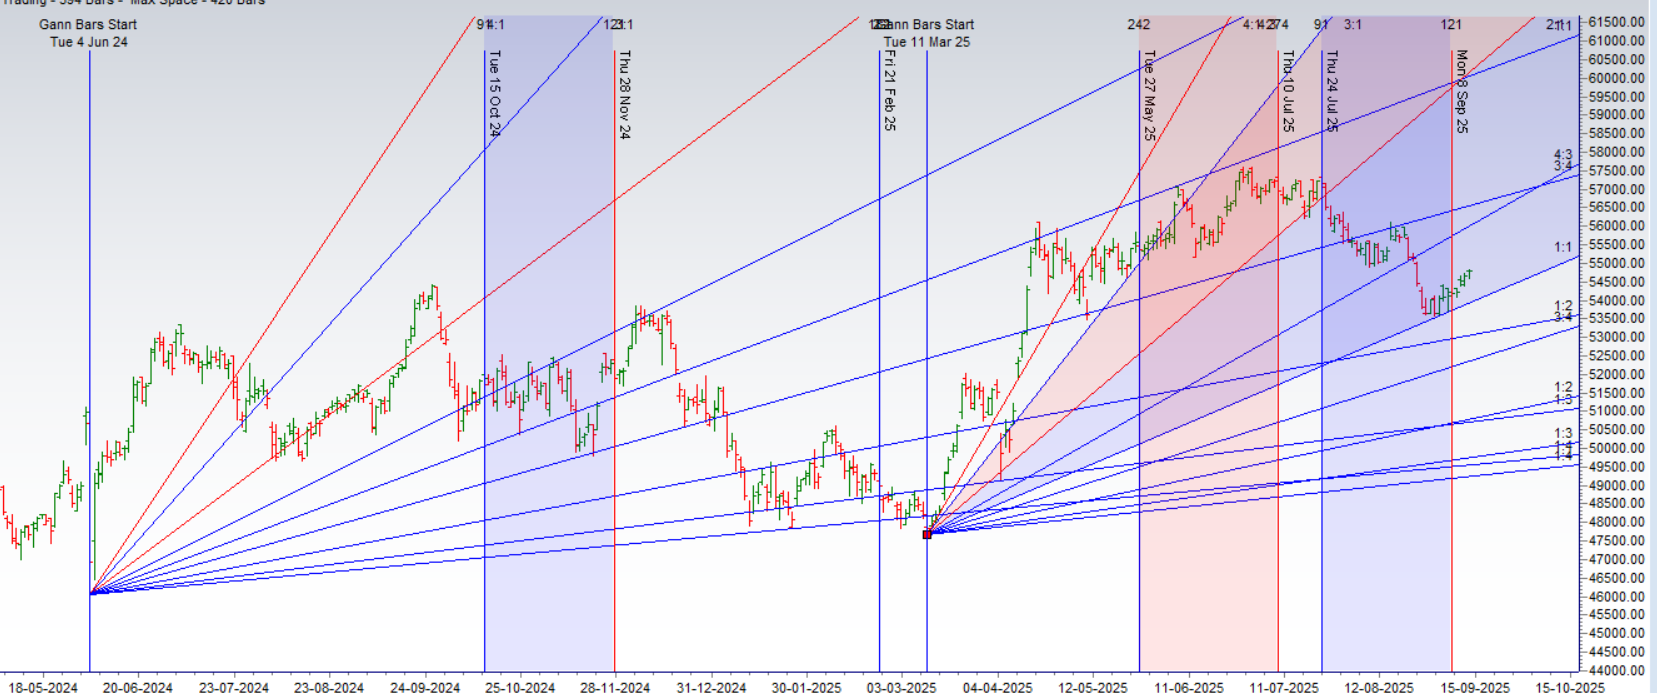
The Bank Nifty is currently caught in a powerful technical stalemate, with bullish momentum being decisively checked by a pre-calculated and formidable zone of Gann resistance. The market’s inability to surmount this hurdle, combined with the convergence of significant time-based cycles, has dramatically increased the probability of an imminent bearish reversal.
The entire focus of the market is on the critical resistance range defined by the 54859 Gann Octave point and the 54872 Gann Vibration Number. In Gann analysis, these are not arbitrary levels; they represent points of natural mathematical harmony where the energy of a trend is often balanced, tested, and potentially reversed. The price action on Friday provided a textbook confirmation of this zone’s power. The high of the day was 54852, just a few points shy of the lower end of this range before being firmly rejected. This shows that sellers are aggressively defending this territory, and the buyers currently lack the force to break through.
This price-based resistance is now being amplified by a powerful confluence of time-based events, whose impact is expected to be felt directly on Monday’s session:
Sun Conjunct Mercury: This astrological alignment often coincides with a shift in market psychology, communication, and short-term trends. It can bring about a moment of clarity or a decisive change in direction.
Eclipse Degree Date: These are historically significant dates that act as temporal pivot points, having a high correlation with market tops, bottoms, and trend reversals.
When a market is struggling to overcome a major price barrier precisely as it enters a significant time-based window for a reversal, the setup becomes exceptionally potent. The equilibrium is fragile, and the path of least resistance often follows the direction indicated by the failure at resistance.
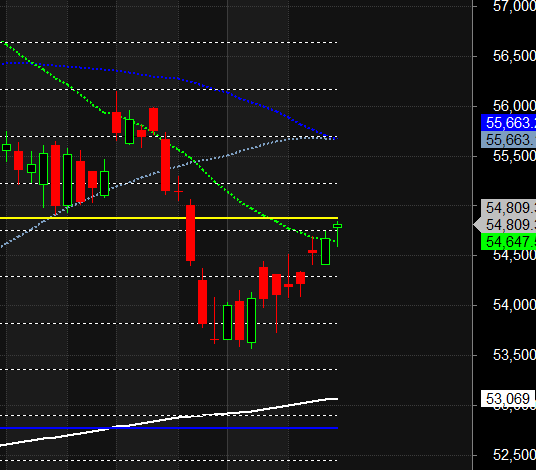
The scenario for the coming sessions is therefore sharply defined. Given the Bank Nifty’s clear failure to cross the 54859-54872 resistance zone, a downward move is now the most probable outcome. The energy from the weekend’s time cycles is likely to act as the catalyst for this bearish turn. The immediate downside target for this potential move is the support zone identified between 54500 and 54334. A failure to hold above the Gann wall will signal that sellers have taken control, and a swift test of this lower range should be expected.
Bank Nifty Trade Plan for Positional Trade ,Bulls will get active above 54878 for a move towards 55110/55342. Bears will get active below 54646 for a move towards 54414/54183
Bank Nifty August Futures Open Interest Volume stood at 24.6 lakh, with liqudiation of 1.1 Lakh contracts. Additionally, the Increase in Cost of Carry implies that there was a covering of LONG positions today.
Bank Nifty Advance Decline Ratio at 02:09 and Bank Nifty Rollover Cost is @55309 closed below it.
BANK Nifty Gann Monthly Trend Change level 54666 closed above it.
Bank Nifty closed above its 21SMA @54666 ,Trend is Sell on Rise till below 54872
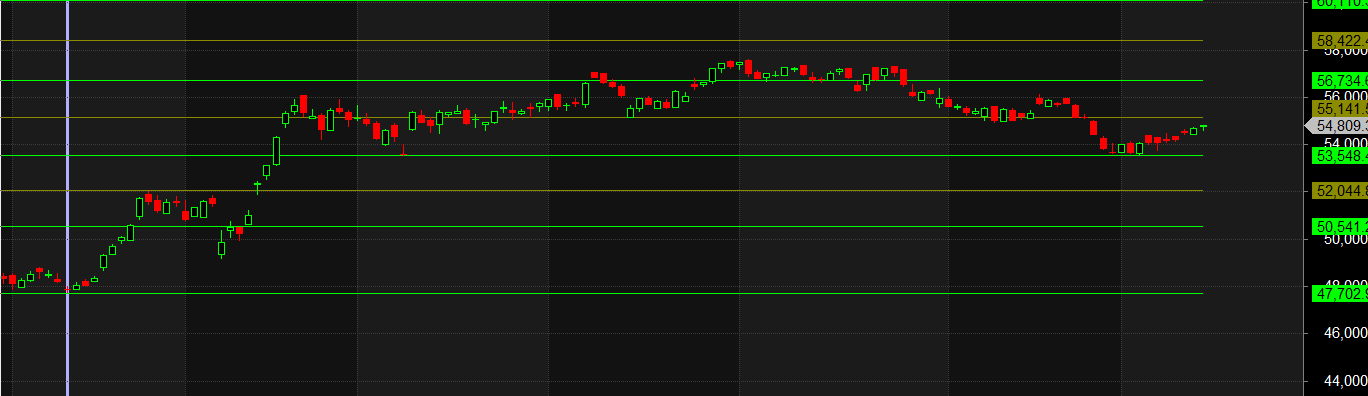
Traders who follow the musical octave trading path may find valuable insights in predicting Bank Nifty’s movements. According to this path, Bank Nifty may follow a path of 53548-55141-56734-58422. This means that traders can take a position and potentially ride the move as Bank Nifty moves through these levels. Of course, it’s important to keep in mind that trading is inherently risky and market movements can be unpredictable.
According to the Bank Nifty options chain, the call side has the highest open interest (OI) at the 55000 strike, followed by the 55500 strike. On the put side, the 54500 strike has the highest OI, followed by the 54000 strike.This indicates that market participants anticipate Bank Nifty to stay within the 54500-55500 range.
The Bank Nifty options chain shows that the maximum pain point is at 55000 and the put-call ratio (PCR) is at 1.02 Typically, when the PCR open interest ranges between 0.90 and 1.05, the market tends to remain range-bound. PCR is on extreme end suggesting we can see sharp reversal .
Successful trading requires a deep understanding of the market, a solid strategy, and, most importantly, a well-prepared http://mindset.it demands concentration, preparation, and an awareness of the psychological challenges that come with it.
For Positional Traders, The Bank Nifty Futures’ Trend Change Level is At 54478. Going Long Or Short Above Or Below This Level Can Help Them Stay On The Same Side As Institutions, With A Higher Risk-reward Ratio. Intraday Traders Can Keep An Eye On 54973 , Which Acts As An Intraday Trend Change Level.
Wishing you good health and trading success as always.As always, prioritize your health and trade with caution.
As always, it’s essential to closely monitor market movements and make informed decisions based on a well-thought-out trading plan and risk management strategy. Market conditions can change rapidly, and it’s crucial to be adaptable and cautious in your approach.