


Decoding the FIIs’ Sleight of Hand: Short Covering Masquerades as Bullish Buying
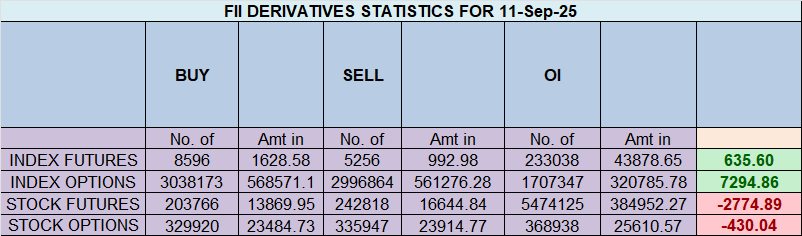
At first glance, the FII data for the Nifty Index Futures on September 11, 2025, seems to signal a clear bullish turn. A net buying figure of 1,425 contracts, valued at a substantial ₹268 crores, coupled with a modest increase in open interest of 543 contracts, could easily be misinterpreted as the “smart money” initiating fresh, aggressive long positions. However, a deeper dive into the underlying activity reveals a far more complex and tactical maneuver. This was not a day of newfound bullish conviction; it was a day of strategic profit-taking and repositioning.
The Real Story: A Tactical Retreat, Not a Bullish Charge
The most critical insight comes from the breakdown of FII activity. While they did add 1,195 new long contracts, the far more dominant action was the covering of a massive 2,145 short contracts. This means the bulk of the FIIs’ buying power was used not to bet on a future rally, but to close out and take profits on their existing, successful bearish bets. This is a classic short-covering rally, where the buying is technically driven by sellers locking in their gains, which can create a sharp but often misleading upward price movement.
The small increase in open interest further confirms this narrative. The large number of closed shorts (which reduces OI) was almost entirely offset by the smaller number of new longs (which increases OI), resulting in a negligible net change. This signifies a market churning and repositioning, not a one-sided, high-conviction buying frenzy.
The Unwavering Bearish Stance
Despite this significant short covering, the FIIs’ overall strategic outlook remains overwhelmingly bearish. Their Long/Short ratio saw a negligible shift from 0.11 to 0.12. This means their strategic positioning is still 89% short and only 11% long. To put it in perspective, they have simply taken some chips off the table from a winning bearish hand; they have not folded their hand or started betting on the other side. This tactical profit-taking may even be a prelude to re-establishing shorts at a more favorable, higher price level created by this very rally.
The Confused Retail Crowd
In stark contrast, the Client (retail) segment appears to be in a state of confusion, de-leveraging on both sides of the market. They covered 1,062 long contracts and 740 short contracts, indicating a reduction in overall exposure. This is typical behavior of traders who have been whipsawed by volatility and are now reducing risk rather than taking a high-conviction stance. Their overall Long/Short ratio remains stubbornly high at 2.49 (71% long), leaving them dangerously exposed if this short-covering rally proves to be temporary.
The Realities of Trading: Beyond the Glamour and Temptation
Last Analysis can be read here
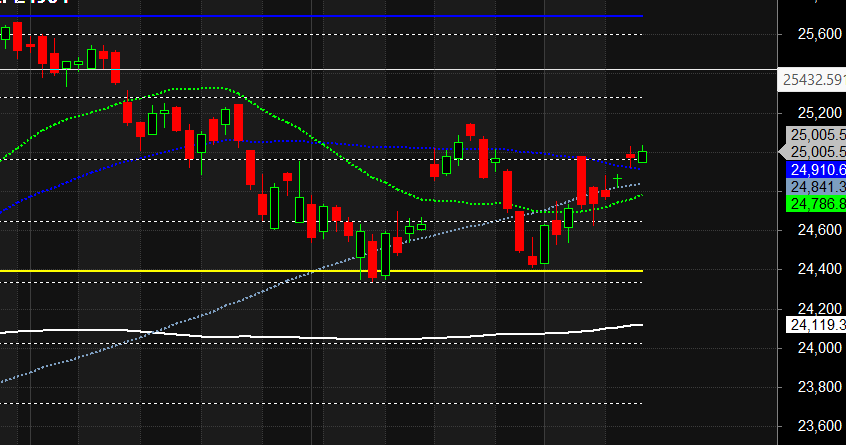
In a significant victory for the bulls, the Nifty index finally achieved a decisive close above the psychologically crucial 25000 mark. This move was underpinned by favorable global cues, as US inflation data came in line with expectations, bolstering bets that the Federal Reserve will move forward with interest rate cuts. A more dovish Fed is a powerful tailwind for global equities, and this sentiment has put the bulls firmly in the driver’s seat.
This positive backdrop is expected to translate into a gap-up opening tomorrow, carrying the momentum forward. By conquering last week’s high of 24980, the bulls have successfully turned a previous resistance level into a new floor of support. Their immediate objective will be to secure a strong weekly close above this level, cementing their control and building a base for a continued rally.
However, the path higher is immediately challenged by a formidable and crucial supply zone, identified between 25125 and 25134. This narrow, 9-point range represents a significant technical and quantitative hurdle where sellers are anticipated to emerge in force. The market’s reaction to this specific zone will be the most critical test of the bulls’ newfound strength.
What elevates this technical battle to a moment of supreme importance is the element of time. Tomorrow is a key eclipse degree date, a pre-calculated point in the calendar that often coincides with market reversals, trend culminations, or significant bursts of volatility. A failure at a major price resistance on a known reversal date is one of the most powerful technical signals for a potential trend change. The market is therefore at a rare and dangerous inflection point where powerful price momentum is set to collide with a potent time cycle.
The scenario for tomorrow is now sharply defined, with clear battle lines drawn:
-
The Bullish Mandate: For the rally to prove its sustainability, the bulls must not only test but achieve a strong and decisive close above the 25134 level. Overcoming this supply zone on an eclipse date would be a massive show of force, neutralizing the reversal signal and opening a clear path for the next leg of the rally.
-
The Bearish Reversal Trigger: Conversely, if the Nifty gaps up into the 25125-25134 zone and stalls, forming reversal patterns like a Doji or an Engulfing candle, it would act as a powerful confirmation of the eclipse date’s influence. A failure to close above this range would signal that the sellers have overpowered the buyers, potentially triggering a sharp and swift reversal back towards the 25000 and 24980 levels.
In conclusion, while the breakout above 25000 is undeniably bullish, the market is now facing its most critical test. The collision of price with a major supply zone on a key reversal date creates a high-stakes environment. The price action within the 25125-25134 range will be the ultimate arbiter, likely dictating the market’s next significant directional move. Traders should prepare for heightened volatility.
Nifty Trade Plan for Positional Trade ,Bulls will get active above 25013 for a move towards 25092/25170. Bears will get active below 24935 for a move towards 24857/24778
Traders may watch out for potential intraday reversals at 09:21,10:44,12:28,02:35 How to Find and Trade Intraday Reversal Times
Nifty Sep Futures Open Interest Volume stood at 1.70 lakh cr , witnessing liquidation of 1.68 Lakh contracts. Additionally, the increase in Cost of Carry implies that there was covering of SHORT positions today.
Nifty Advance Decline Ratio at 23:27 and Nifty Rollover Cost is @24980 closed below it.
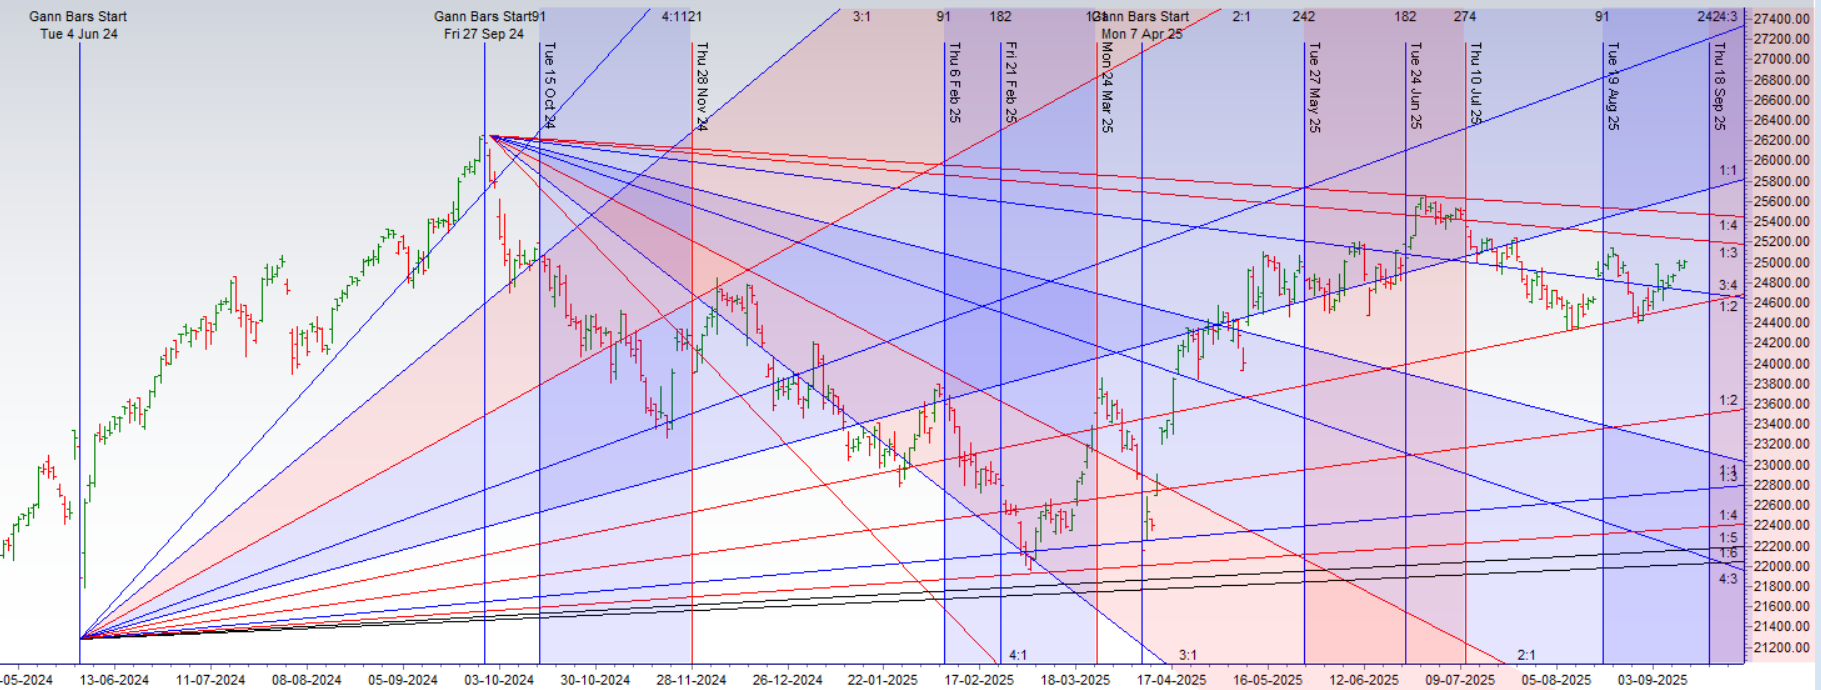
Nifty Gann Monthly Trend Change level 24678 closed above it.
Nifty has closed above its 50 SMA @ 24964 Trend is Buy on Dips till above 24964
Nifty options chain shows that the maximum pain point is at 25000 and the put-call ratio (PCR) is at 1.08.Typically, when the PCR open interest ranges between 0.90 and 1.05, the market tends to remain range-bound.
A Clear Divide: FIIs Bet on Stability While Retail Braces for a Fall
Today’s options market data reveals a fascinating and telling divergence in strategy and sentiment between retail traders and Foreign Institutional Investors (FIIs). While retail participants displayed a scattered, fear-driven approach, the FIIs executed a surgically precise and confident strategy, signaling a clear belief that the market’s immediate downside is limited.
The Retail Position: Conflicted with a Bearish Tilt
The retail segment was highly active but lacked a unified conviction. In the Call options, they showed their skepticism about a significant rally. While they bought 235,000 Call contracts, they simultaneously wrote a larger number, 319,000 contracts. This resulted in a net short position of 84,000 Call contracts, a clear bet that the market’s upside is capped and that premiums from selling Calls are the smarter play.
Their activity in the Put options, however, tells a story of underlying anxiety. They were net buyers of Puts, adding 459,000 long contracts against 405,000 short contracts. Buying Put options is a direct bet on a market decline or a method of purchasing insurance for a long portfolio. The fact that retail traders were net buyers of this insurance, while simultaneously being net sellers of Calls, paints a picture of a participant who is not confident in the upside and is actively hedging against a potential downturn. Their strategy is defensive, scattered, and leans towards a bearish or fearful outlook.
The FII Strategy: A Masterclass in Confidence
In stark contrast, the FIIs’ activity was a model of clarity and conviction. Their actions in the Put market were the most significant and revealing. Firstly, they covered 53,000 of their existing long Put contracts. This is a powerful signal. An institution buys long Puts as a hedge against a market fall; when they actively sell and close these positions, it means they no longer perceive the risk of a decline to be significant enough to warrant holding that insurance.
Secondly, and even more tellingly, they shorted an additional 34,000 Put contracts. By selling Puts, FIIs are taking on the obligation to buy the market at lower levels. They are effectively acting as the “insurance company,” collecting premiums from fearful traders (likely retail) with the strong belief that the market will not drop significantly. It is one of the most confident, bullish-to-neutral stances an institution can take.
Complementing this view, their activity in the Call options was subtly bullish. They were net buyers, adding 45,000 long contracts while shorting only 23,000. This small but clear net long position in Calls shows they are positioning for a potential, albeit perhaps modest, upside.
Conclusion: Follow the Conviction
When we synthesize the data, an unmistakable narrative emerges. The retail crowd is paying for insurance (buying Puts) that the FIIs are gladly selling to them. Furthermore, the FIIs are so confident that the risk of a fall is low that they are simultaneously dismantling their own hedges.
This is a classic “smart money” versus “crowd” dynamic. The FIIs are not forecasting a runaway bull market, but their actions demonstrate a very high conviction that a significant correction is not on the immediate horizon. Their strategy suggests a floor is being established under the market, and that minor dips are more likely to be buying opportunities than the start of a major decline. For a discerning trader, the signal is clear: the high-conviction positioning of the FIIs offers a far more reliable guide than the scattered fear of the retail segment.
In the cash segment, Foreign Institutional Investors (FII) sold 3472 cr , while Domestic Institutional Investors (DII) bought 4045 cr.
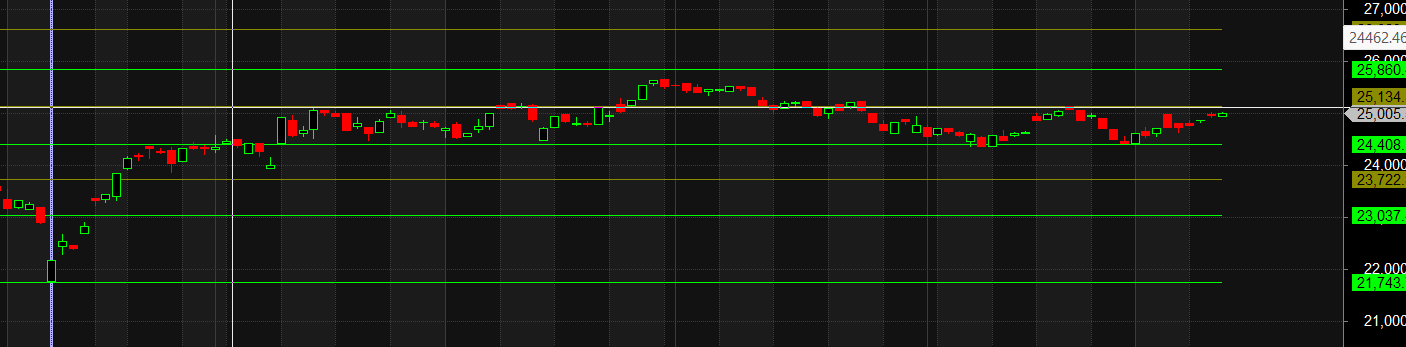
Traders who follow the musical octave trading path may find valuable insights in predicting Nifty’s movements. According to this path, Nifty may follow a path of 23037-23722-24408-25134-25860 This means that traders can take a position and potentially ride the move as Nifty moves through these levels.Of course, it’s important to keep in mind that trading is inherently risky and market movements can be unpredictable.
Successful trading requires a deep understanding of the market, a solid strategy, and, most importantly, a well-prepared http://mindset.it demands concentration, preparation, and an awareness of the psychological challenges that come with it.
For Positional Traders, The Nifty Futures’ Trend Change Level is At 24850 . Going Long Or Short Above Or Below This Level Can Help Them Stay On The Same Side As Institutions, With A Higher Risk-reward Ratio. Intraday Traders Can Keep An Eye On 25091 , Which Acts As An Intraday Trend Change Level.
Nifty Intraday Trading Levels
Buy Above 25055 Tgt 25091, 25144 and 25196 ( Nifty Spot Levels)
Sell Below 24988 Tgt 24951, 24912 and 24854 (Nifty Spot Levels)
Wishing you good health and trading success as always.As always, prioritize your health and trade with caution.
As always, it’s essential to closely monitor market movements and make informed decisions based on a well-thought-out trading plan and risk management strategy. Market conditions can change rapidly, and it’s crucial to be adaptable and cautious in your approach.
► Join Youtube channel : Click here
► Check out Gann Course Details: W.D. Gann Trading Strategies
► Check out Financial Astrology Course Details: Trading Using Financial Astrology
► Check out Gann Astro Indicators Details: Gann Astro Indicators