


FIIs’ Buying Spree in Bank Nifty is Deceptive: A Classic Case of Short Covering, Not New Bullish Bets
On the surface, the data from the Bank Nifty Index Futures on September 11, 2025, appears robustly bullish. Foreign Institutional Investors (FIIs) were significant net buyers, purchasing 1,871 contracts with a substantial notional value of ₹359 crores. For many, this headline figure might be interpreted as a clear signal that the “smart money” is turning optimistic on the banking sector and initiating fresh long positions.
However, this interpretation would be a critical mistake. The key to understanding the true nature of this activity lies in the second, more crucial data point: the net open interest (OI) decreased by 1,281 contracts.
This decrease in OI completely changes the narrative. A decline in open interest signifies that positions are being closed, not opened. When net buying is accompanied by a sharp fall in OI, it is the textbook definition of short covering.
What This Means:
The FIIs were not building new bullish bets. Instead, the overwhelming majority of their buying activity was dedicated to closing out their pre-existing short positions. These are the bearish bets they likely initiated at higher levels. By buying back these contracts, they are locking in the profits from the recent downward or sideways price action.
This has several profound implications for traders:
-
It is Not a Signal of Bullish Conviction: This activity does not represent new confidence in an impending rally. It is a tactical, profit-taking maneuver. The FIIs have identified a level where they are content to cash in their winning bearish trades, likely near a technical support level or ahead of a key event.
-
It Explains the Intraday Bounce: This aggressive buying to cover shorts can create a sharp, but often temporary, “relief rally.” Many retail traders can be lured into this bounce, mistaking it for the beginning of a sustainable new uptrend, while in reality, it is technically-driven buying from previous sellers.
-
The Underlying Stance May Still Be Bearish: Cashing in a short position does not automatically mean an institution has turned bullish. It simply means the risk/reward for that specific trade is no longer favorable. The FIIs could very well be planning to re-initiate new short positions if the relief rally extends to a more attractive resistance level.
Conclusion:
Traders must look beyond the headline buying figure. The FII activity in the Bank Nifty on September 11th was not a sign of renewed optimism but a clear signal of profit-taking on bearish bets. The decrease in open interest is the definitive evidence. While this short covering can fuel a temporary bounce, it should be viewed with extreme caution. This is not the time to turn aggressively bullish; rather, it’s a time to observe if this relief rally is used by the smart money as an opportunity to sell again at higher prices.

Bank Nifty August Futures Open Interest Volume stood at 25.8 lakh, with liqudiation of 1 Lakh contracts. Additionally, the Increase in Cost of Carry implies that there was a covering of LONG positions today.
Bank Nifty Advance Decline Ratio at 07:05 and Bank Nifty Rollover Cost is @55309 closed below it.
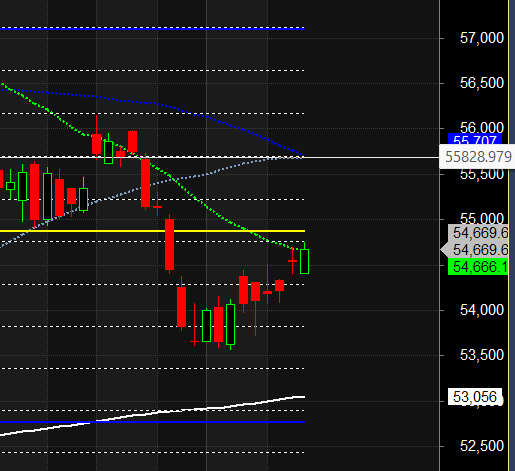
BANK Nifty Gann Monthly Trend Change level 54666 closed above it.
Bank Nifty closed above its 21SMA @54666 ,Trend is Sell on Rise till below 54872
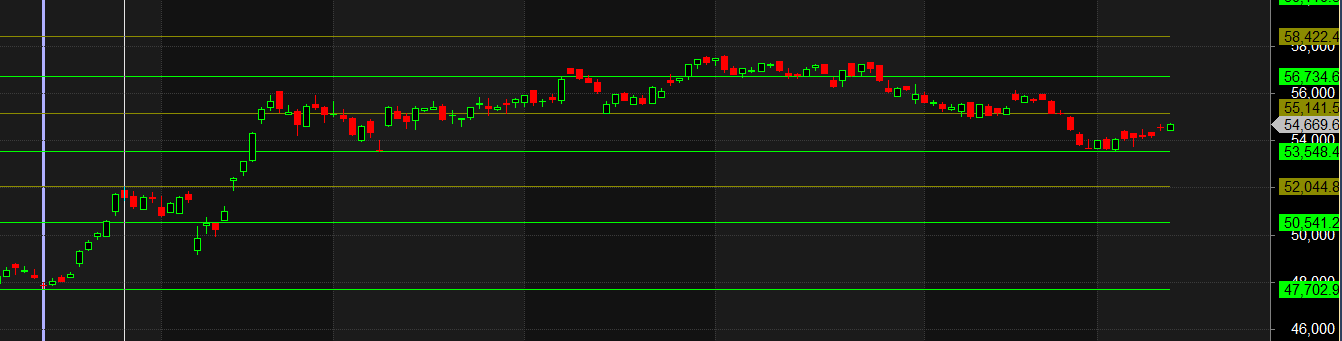
Traders who follow the musical octave trading path may find valuable insights in predicting Bank Nifty’s movements. According to this path, Bank Nifty may follow a path of 53548-55141-56734-58422. This means that traders can take a position and potentially ride the move as Bank Nifty moves through these levels. Of course, it’s important to keep in mind that trading is inherently risky and market movements can be unpredictable.
According to the Bank Nifty options chain, the call side has the highest open interest (OI) at the 55000 strike, followed by the 55500 strike. On the put side, the 54500 strike has the highest OI, followed by the 54000 strike.This indicates that market participants anticipate Bank Nifty to stay within the 54500-55500 range.
The Bank Nifty options chain shows that the maximum pain point is at 54900 and the put-call ratio (PCR) is at 1.01 Typically, when the PCR open interest ranges between 0.90 and 1.05, the market tends to remain range-bound. PCR is on extreme end suggesting we can see sharp reversal .
Successful trading requires a deep understanding of the market, a solid strategy, and, most importantly, a well-prepared http://mindset.it demands concentration, preparation, and an awareness of the psychological challenges that come with it.
For Positional Traders, The Bank Nifty Futures’ Trend Change Level is At 54433. Going Long Or Short Above Or Below This Level Can Help Them Stay On The Same Side As Institutions, With A Higher Risk-reward Ratio. Intraday Traders Can Keep An Eye On 54851 , Which Acts As An Intraday Trend Change Level.
BANK Nifty Intraday Trading Levels
Buy Above 54700 Tgt 54851, 54986 and 55122 (BANK Nifty Spot Levels)
Sell Below 54595 Tgt 54444, 54323 and 54200 (BANK Nifty Spot Levels)
Wishing you good health and trading success as always.As always, prioritize your health and trade with caution.
As always, it’s essential to closely monitor market movements and make informed decisions based on a well-thought-out trading plan and risk management strategy. Market conditions can change rapidly, and it’s crucial to be adaptable and cautious in your approach.
► Join Youtube channel : Click here
► Check out Gann Course Details: W.D. Gann Trading Strategies
► Check out Financial Astrology Course Details: Trading Using Financial Astrology
► Check out Gann Astro Indicators Details: Gann Astro Indicators