


“When planetary tension builds, markets respond—often before the news catches up.”
MCX GOLD Gann Angle Chart
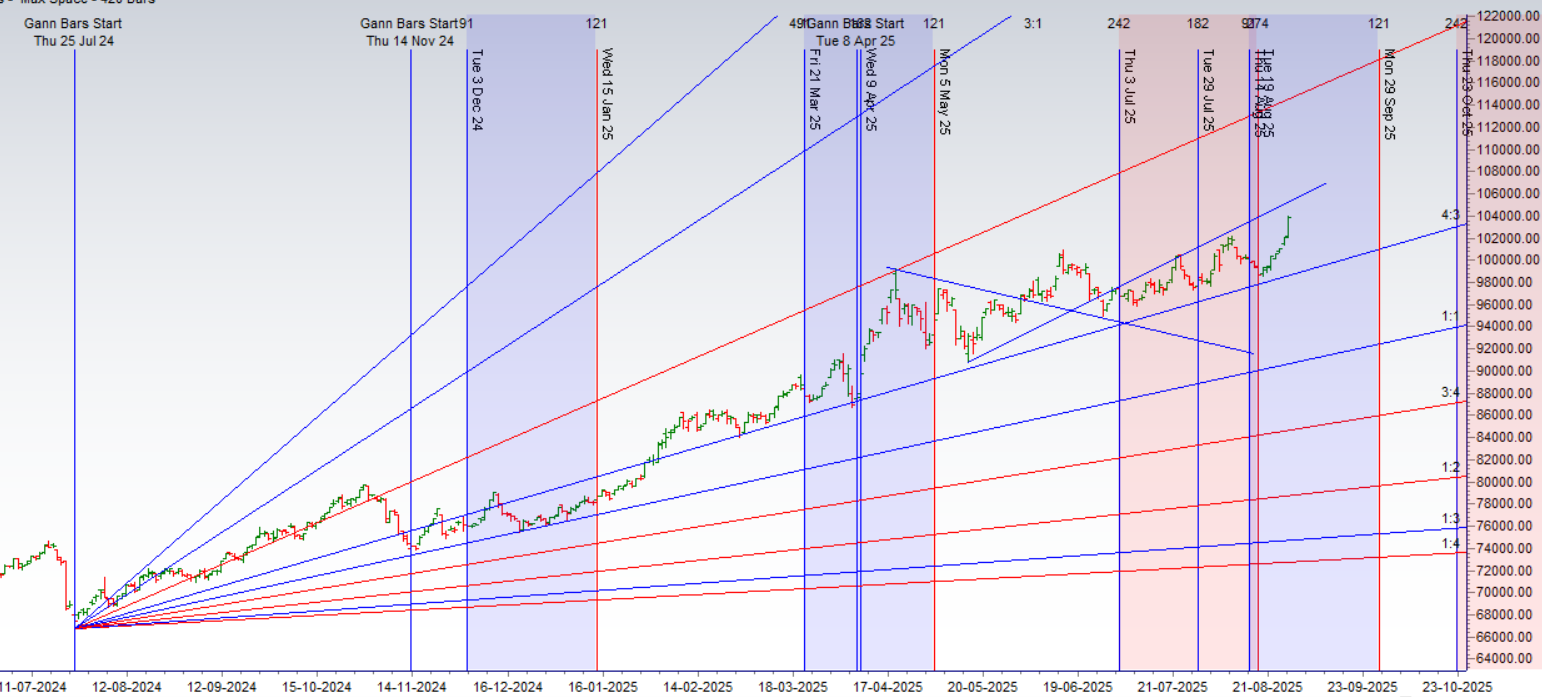
Gold is heading for 7 days on rise and heading into gann angle resistance zone.
MCX GOLD Supply Demand Zone
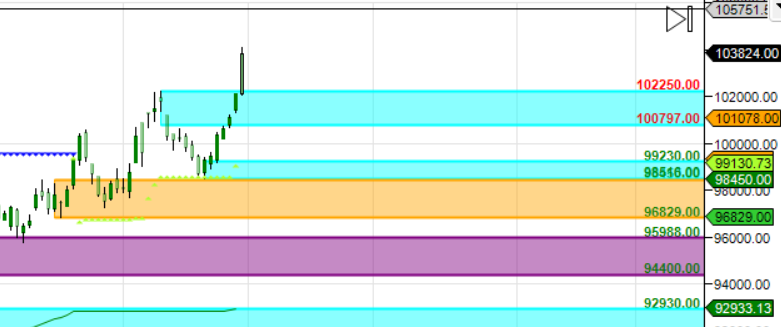
MCX GOLD Supply Demand Chart : Demand in range of 102250-10200 , Supply in range of 10450-10500
MCX GOLD Harmonic Analysis
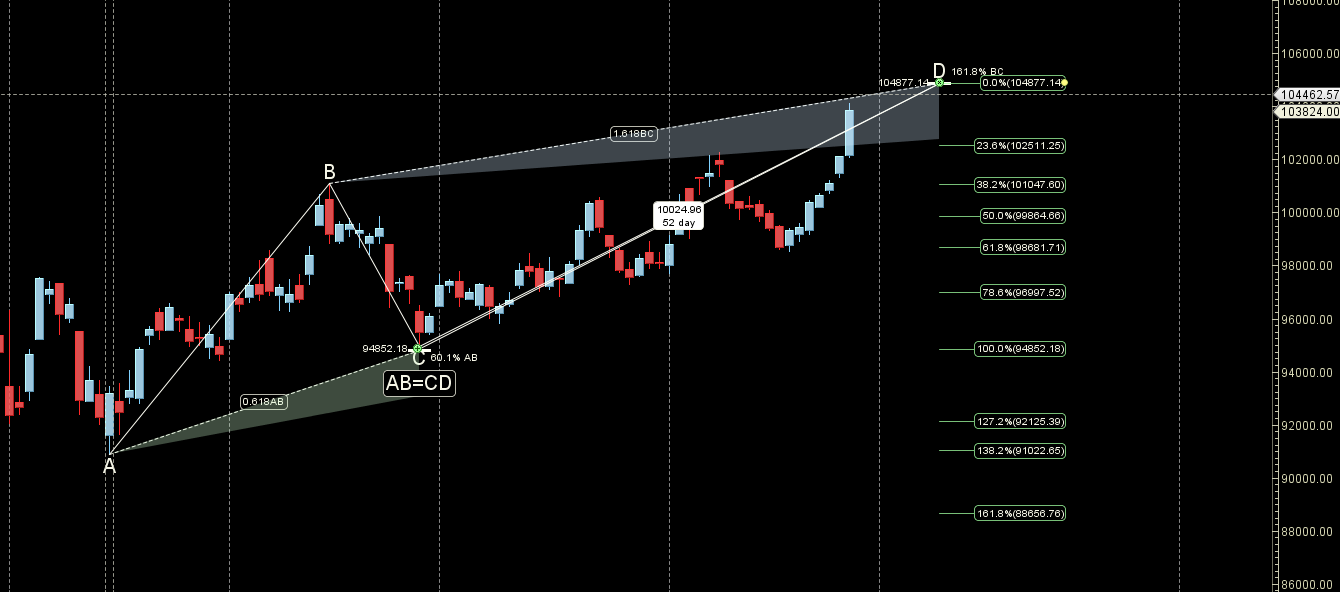
Price is approaching PRZ zone of ABCD Harmonic Pattern.
MCX GOLD Weekly
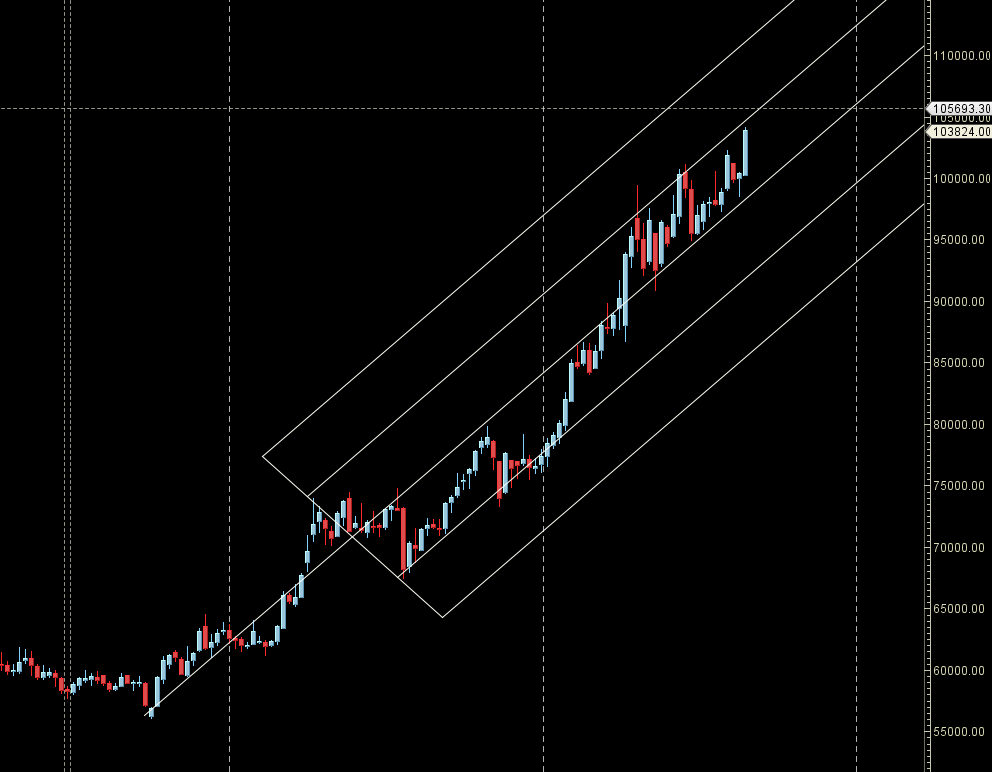
Price has formed Weekly Bullish near AF Resistance Zone.
MCX GOLD Monthly
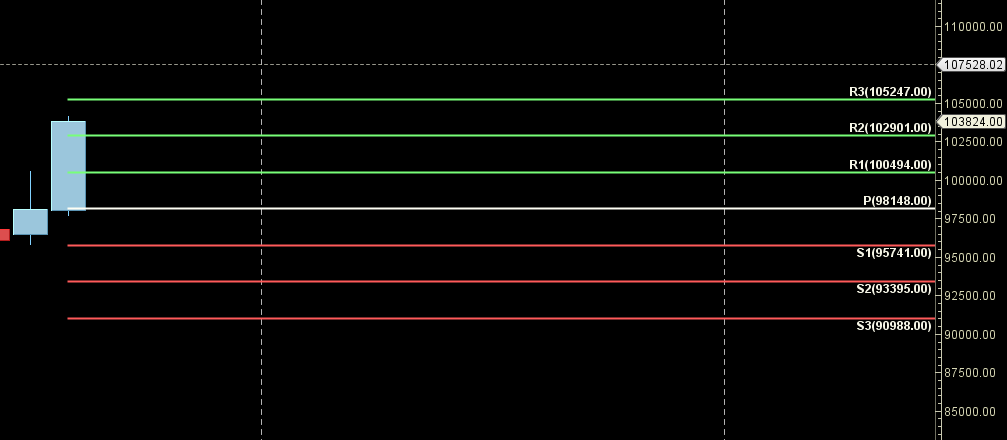
105247 Monthly Resistance and 102901 Monthly Support.
GOLD Astro/Gann Trend Change Date
Key Pivot Dates: Watch 01 September
GOLD Weekly Levels
Weekly Trend Change Level:103775
Weekly Resistance:104420,105068,105717,106368
Weekly Support: 103132,102490,101851,101214,100579
Levels Mentioned are for Current Month Future
Learn More:
W.D. Gann Trading Strategies – Learn how to decode markets using price, time, and geometry.
Trading Using Financial Astrology – Discover how planetary motion impacts market behavior and how to trade it effectively.
Ready to Trade Like a Time-Master?
Join our one-on-one mentorship to master astro-timing, Gann analysis, and institutional-grade setups.