


Overall Weekly Astrological Theme: A Week of Potential Reversals and Heightened Volatility
The astrological setup for the week points towards a period of significant market activity, with the potential for major turning points and increased price swings. The early part of the week, particularly Monday and Tuesday, appears to be the most critical period to watch for potential trend reversals across all analyzed markets.
Sensex is likely to experience a pivotal week, with strong astrological indicators suggesting a potential shift in the prevailing trend.
-
Monday, August 18th: The week begins with two potent astrological events. The “Bayer Rule 27” activation, linked to Mercury’s specific speed, suggests conditions are ripe for “big tops and big major bottoms.” This indicates a high probability of a significant market reversal. Simultaneously, the Moon at its Farthest North position can amplify market sentiment and contribute to reaching extreme price levels before a turn. Traders should exercise extreme caution as the market could be establishing a significant high or low for the near term.
-
Tuesday, August 19th: Mercury reaching its Extreme Declination often correlates with periods of high volatility, erratic price action, and increased speculation. This could either see a continuation of the reversal that may have started on Monday or a day of sharp, unpredictable swings.
-
Friday, August 22nd: The Sun’s ingress into Virgo may bring a more analytical and discerning tone to the market. Following the potential turmoil of the early week, sentiment may start to stabilize as traders perhaps focus more on fundamental details.
-
Weekend Influence (Looking Ahead): The New Moon and a Moon-Mercury conjunction with a “Positive Bias” on Saturday, August 23rd, could influence market sentiment leading into Friday’s close. This suggests that if the market experienced a downturn early in the week, it might find a supportive base and end the week on a more optimistic note, setting a positive tone for the following week.
Forecast Summary for Equities: Expect high volatility at the beginning of the week with a strong possibility of a major trend reversal. The latter part of the week may see a calming of volatility with a potentially more positive undertone emerging.
SENSEX Harmonic Pattern
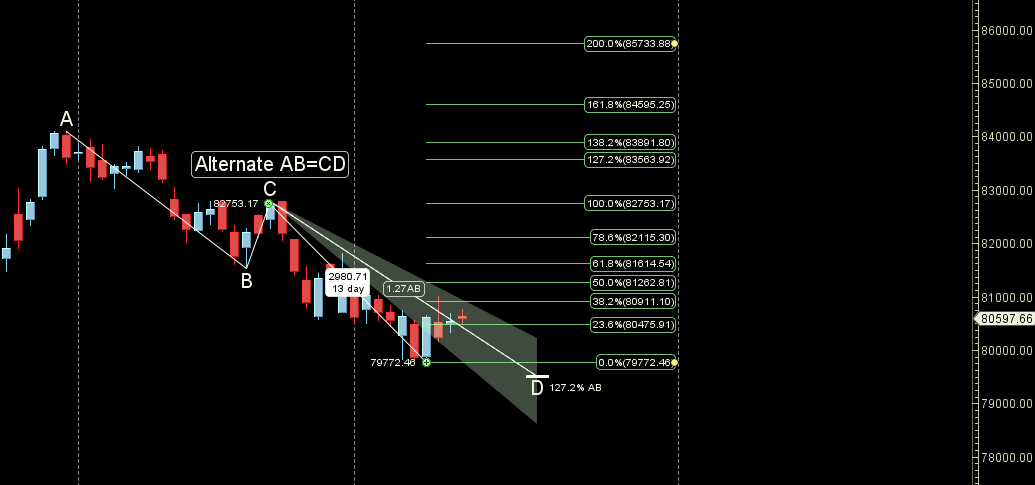
82115 is harmonic target
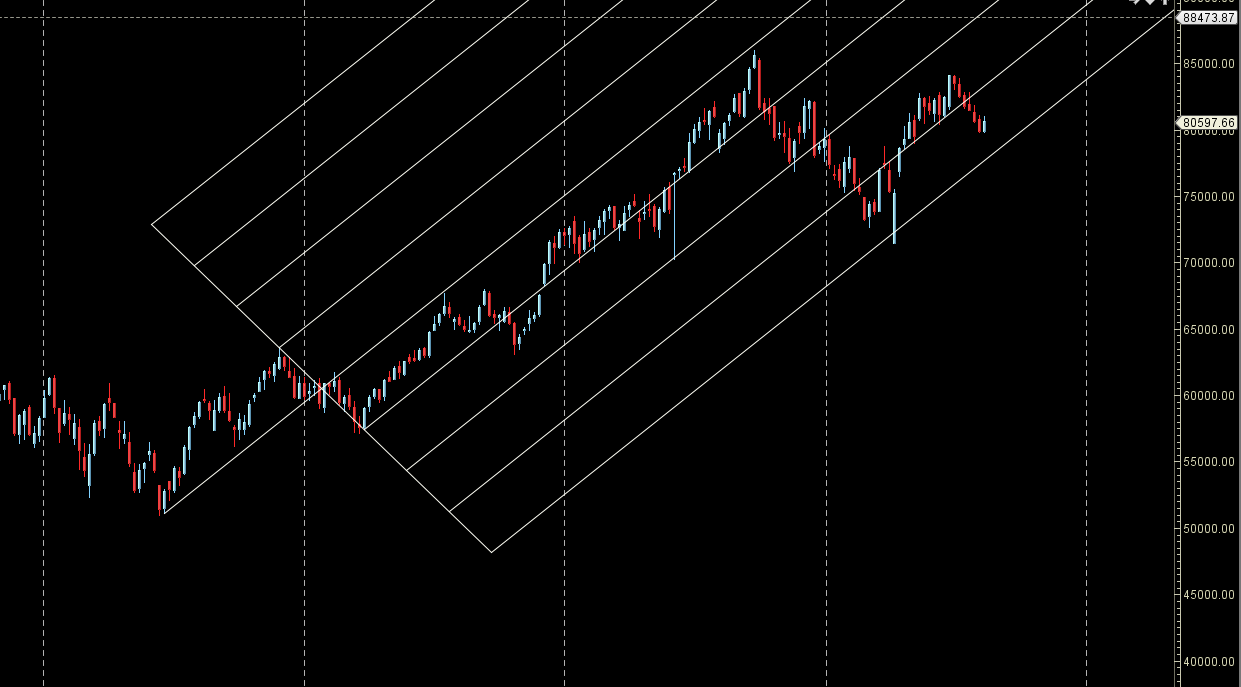
SENSEX Gann Angles
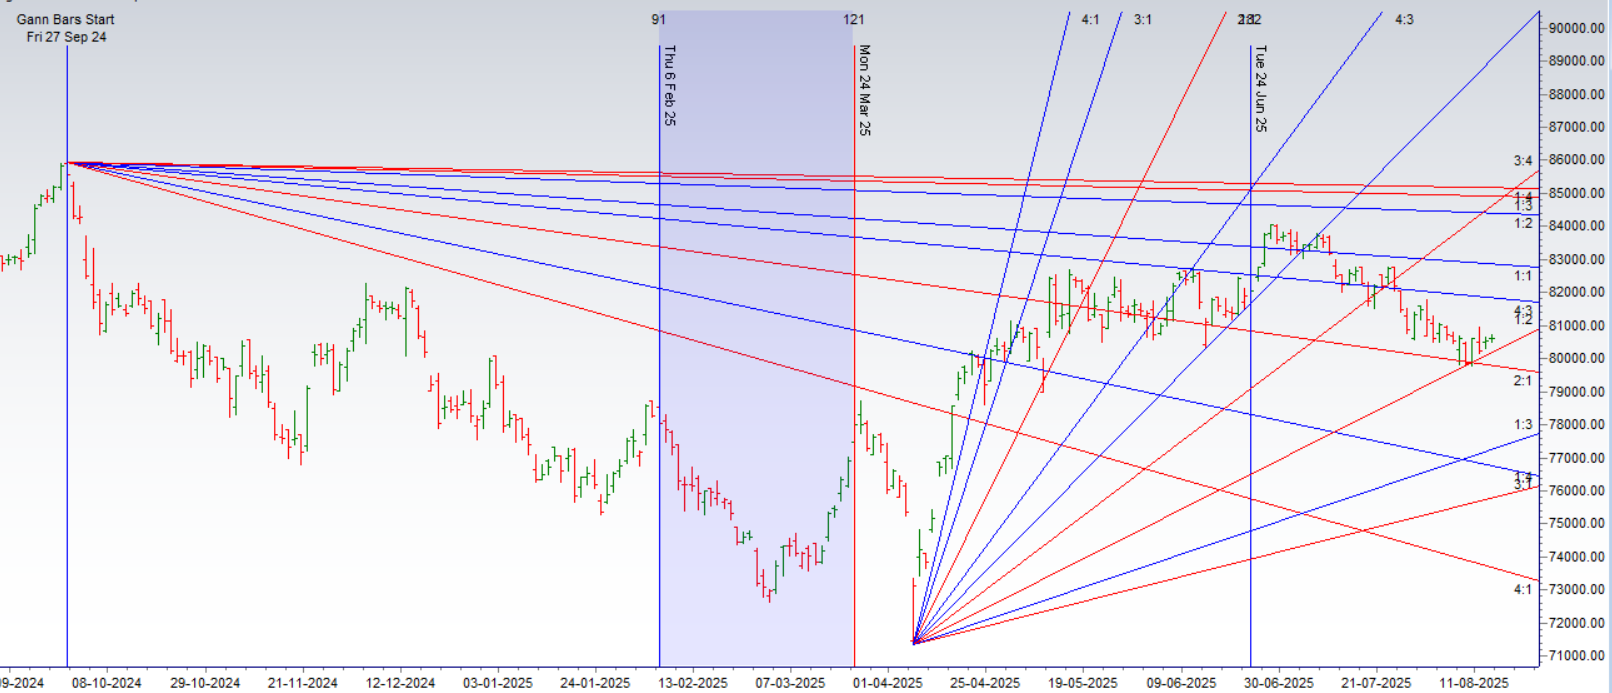
Price has held to its 1×2 ganna angle support zone
SENSEX Supply and Demand
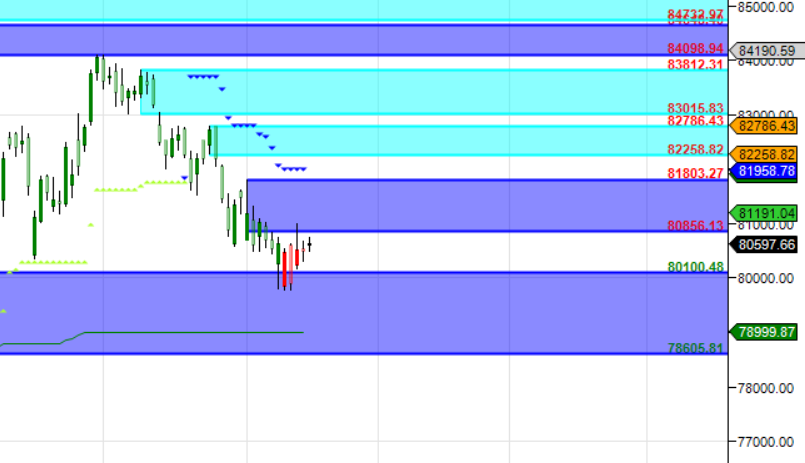
Self Explanatory Chart
SENSEX Time Analysis Pressure Dates
Key Pivot Dates: Watch August 20
SENSEX Weekly Chart
Rally after 6 Weeks on Decline
SENSEX Monthly Charts
81898 is Monthly resistance zone 79862 is Support zone.
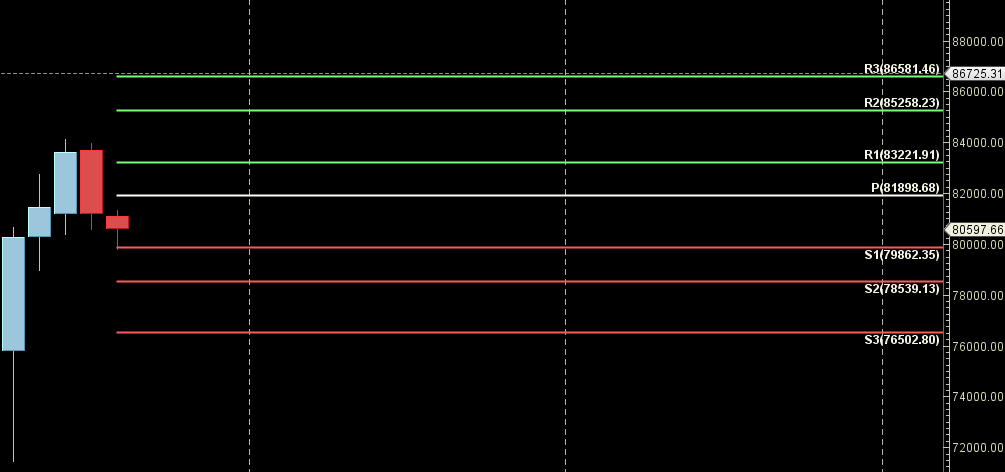
SENSEX Weekly Levels
SENSEX Trend Deciding Level: 81188
SENSEX Resistance: 81470,81753,82035,82444
SENSEX Support:80905,80623,80340,80058
Levels mentioned are SENSEX Spot
Learn More:
W.D. Gann Trading Strategies – Learn how to decode markets using price, time, and geometry.
Trading Using Financial Astrology – Discover how planetary motion impacts market behavior and how to trade it effectively.
Ready to Trade Like a Time-Master?
Join our one-on-one mentorship to master astro-timing, Gann analysis, and institutional-grade setups.
Call: 09985711341
Email: bhandaribrahmesh@gmail.com