


The week is front-loaded with powerful astrological indicators suggesting major turning points and high volatility. The focus for Gold will be on the potential for a significant trend reversal early in the week, followed by a period of adjustment.
Gold
The astrological setup appears particularly significant for precious metals, with a potential for establishing a notable low point during the week.
-
Monday, August 18th:
-
Astrological Drivers: Moon at Farthest North declination; “Bayer Rule 27” activation.
-
Forecast: This is the most critical day of the week. The combination of these two factors signals a very high probability of a major price extreme. Gold could see a sharp, exhaustive move, likely establishing a significant peak or, more probably, a major bottom. Traders should be on high alert for a trend reversal.
-
-
Tuesday, August 19th:
-
Astrological Driver: Mercury at Extreme Declination.
-
Forecast: Expect heightened volatility and erratic price action. If a low was made on Monday, this day could see a sharp rebound or a retest of that low. The market may be indecisive and choppy as it reacts to the previous day’s potential reversal.
-
-
Wednesday, August 20th & Thursday, August 21st:
-
Astrological Drivers: No major aspects are listed.
-
Forecast: These are likely to be transitional days. Gold will probably be consolidating and digesting the volatile moves from the start of the week. The market will be attempting to confirm the new trend that may have been established.
-
-
Friday, August 22nd:
-
Astrological Driver: Sun enters Virgo.
-
Forecast: The market may become more subdued as it heads into the weekend. The focus may shift slightly towards fundamentals. Importantly, traders will be anticipating the New Moon on Saturday, August 23rd. New Moons are often associated with price lows for Gold. Combined with the “Positive Bias” noted for the 23rd, Friday could see prices bottoming out or showing weakness, potentially presenting a buying opportunity ahead of a rally in the following week.
-
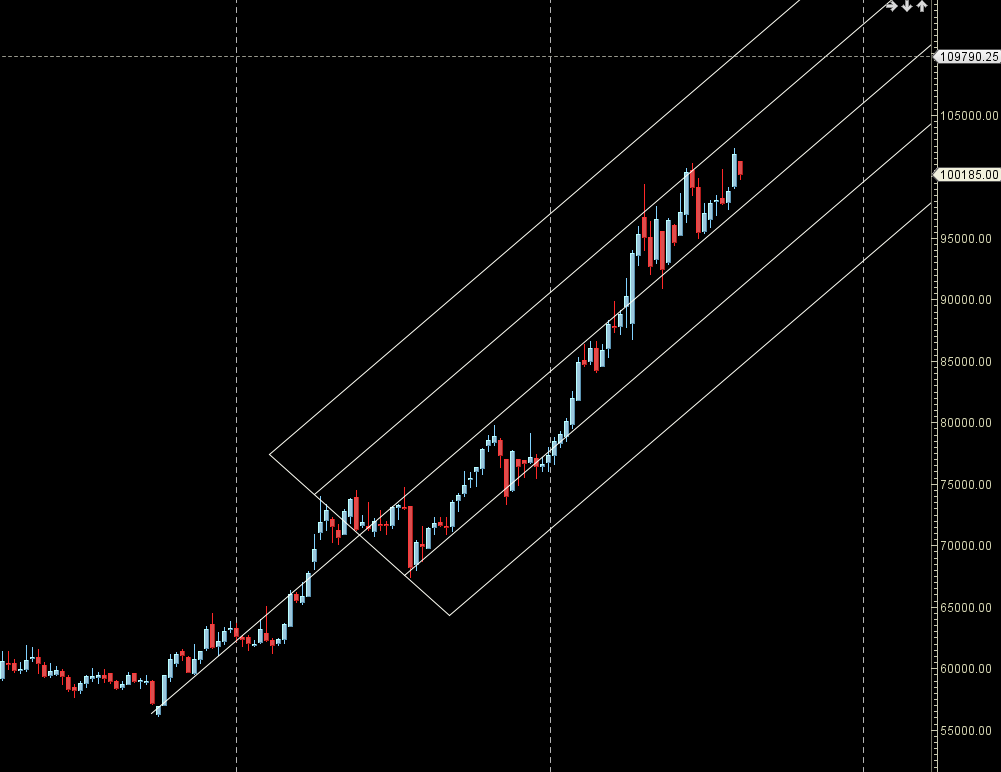
MCX GOLD Gann Angle Chart

Gold is back to its Gann time cycle and can see a good counter trend rally once above 10557
MCX GOLD Supply Demand Zone
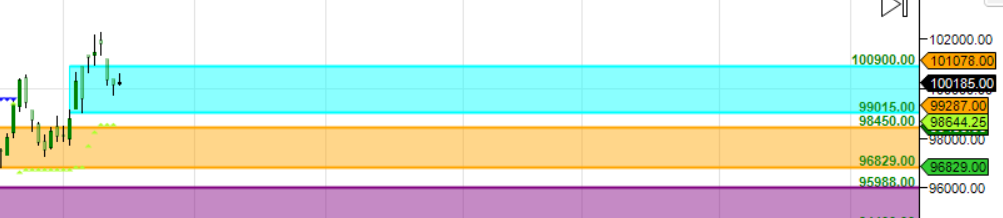
MCX GOLD Supply Demand Chart : Demand in range of 99015-99100 , Supply in range of 100900-100100
MCX GOLD Harmonic Analysis
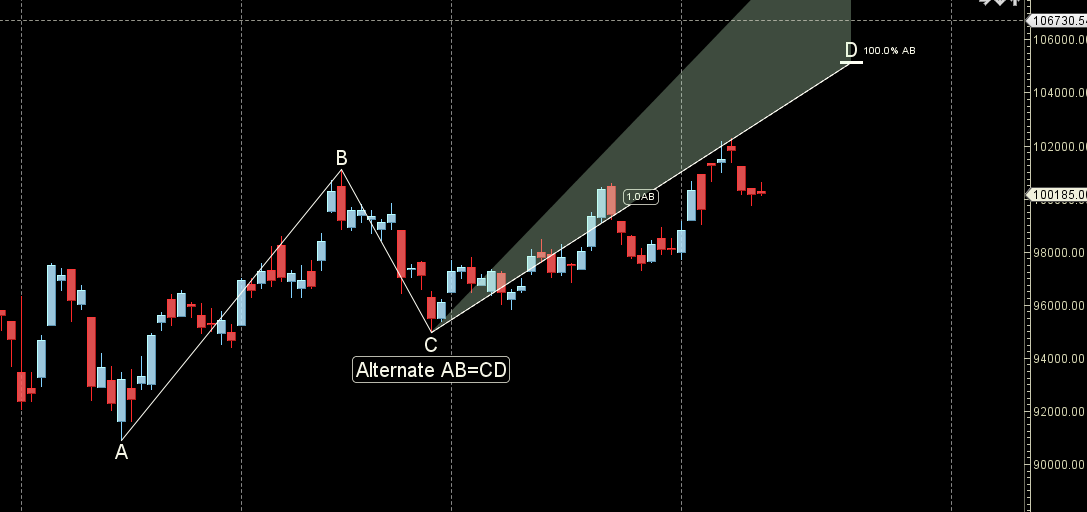
Price is forming an Alternate ABCD pattern PRZ zone at 100500
MCX GOLD Weekly
Price has formed Weekly Inside Bar
MCX GOLD Monthly
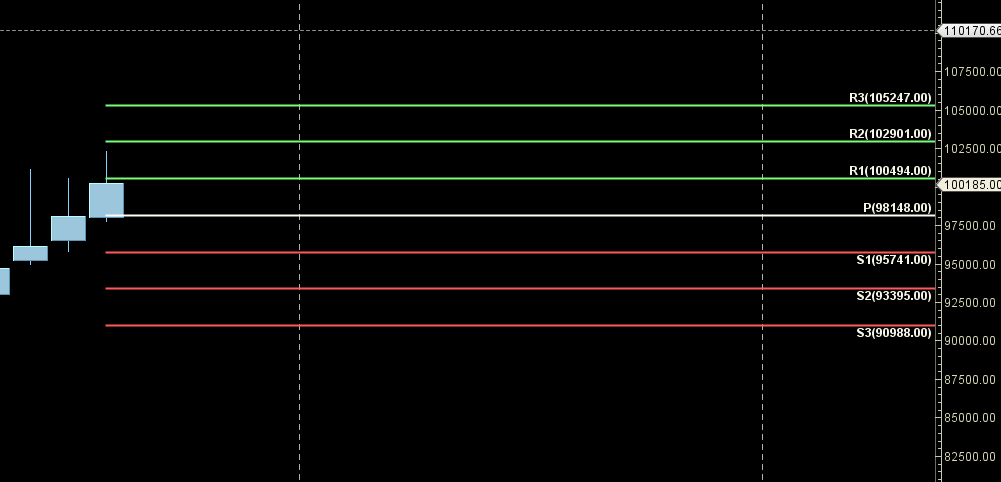
100494 Monthly Resistance and 98148 Monthly Support.
GOLD Astro/Gann Trend Change Date
Key Pivot Dates: Watch 18/22 August
GOLD Weekly Levels
Weekly Trend Change Level:100237
Weekly Resistance:100557,100877,101196,101516
Weekly Support: 99917,99598,99212,98900
Levels Mentioned are for Current Month Future
Learn More:
W.D. Gann Trading Strategies – Learn how to decode markets using price, time, and geometry.
Trading Using Financial Astrology – Discover how planetary motion impacts market behavior and how to trade it effectively.
Ready to Trade Like a Time-Master?
Join our one-on-one mentorship to master astro-timing, Gann analysis, and institutional-grade setups.
Your writing is like a breath of fresh air in the often stale world of online content. Your unique perspective and engaging style set you apart from the crowd. Thank you for sharing your talents with us.