


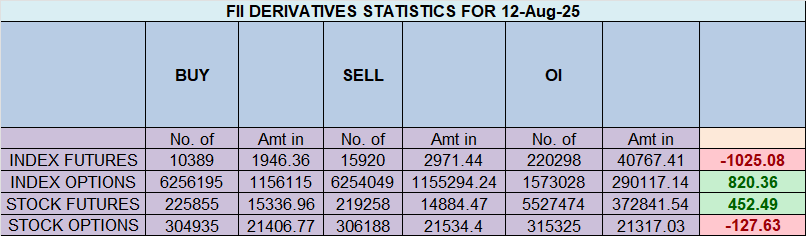
Despite an initial mention of a “Bullish instance,” the derivatives data from August 12th reveals a deeply bearish and aggressive stance from Foreign Institutional Investors (FIIs), who actively shorted the market. They have escalated their negative conviction to an extreme level, pushing their long-to-short ratio to a perilously low 08:92. This massive institutional short-selling was directly absorbed by optimistic retail clients, who added new long positions. The significant increase in Open Interest confirms that this is not a mere reshuffling of old positions but a fresh, high-stakes battle being waged. This extreme divergence serves as a major red flag, indicating the market is exceptionally vulnerable to a sharp, downward move.
1. FII Activity: An Unambiguous and Aggressive Bearish Assault
The actions undertaken by FIIs were a clear and forceful statement of their negative outlook.
-
Massive Fresh Shorting: FIIs added a substantial 4,769 new short contracts, while simultaneously reducing their long exposure. The net activity of shorting 3,665 contracts, with a significant value of 676 crore, underscores the high level of capital and conviction behind their bearish bets. This is not passive hedging; it is active, aggressive positioning for a decline.
-
Extreme Pessimism: The resulting positioning ratio of 08:92 (a mere 0.086) is at a level of extreme institutional fear. This means for every single contract FIIs are holding for a potential upside, they are holding over eleven contracts betting on a fall. This maximalist bearish stance suggests they anticipate a significant market downturn and are positioning for it with overwhelming force.
2. Client Behavior: The Unflinching Bullish Counterparty
The retail client segment has taken the diametrically opposite view, displaying remarkable confidence in the face of institutional selling pressure.
-
Absorbing the Selling: Clients added 2,917 new long contracts while also covering over 2,000 short positions. This shows they are actively buying into the FII-led decline, believing the market is poised for a rally.
-
Deep-Seated Optimism: Their overall long-to-short ratio remains at a highly optimistic 70:30. This steadfast bullishness creates a classic, high-tension standoff between “smart money” and retail.
3. The Crucial Confirmation: Rising Open Interest (OI)
The increase in Open Interest by nearly 4,000 contracts is the critical piece of evidence that confirms the severity of this situation.
-
Fresh Positions Being Built: A significant rise in OI indicates that new money is flowing into the market to create new positions. This is not just old bulls selling to old bears; this is a fresh battle being initiated.
-
The Bearish Signal: In this context, the OI increase was fueled by FIIs creating fresh shorts and clients creating fresh longs. A combination of price pressure from institutional selling and rising Open Interest is a classic and powerful bearish confirmation signal. It indicates the market is absorbing a large number of new bearish bets, making it “heavier” and more susceptible to a sharp fall.
Market Outlook and Strategic Implications
-
Extreme Downside Risk: The weight of institutional money is now overwhelmingly on the short side. This makes the market extremely vulnerable, and any minor rallies are likely to be sold into aggressively.
-
The Path of Maximum Pain: With retail clients so heavily positioned on the long side, a significant market decline would inflict the most financial damage on the largest number of participants—a scenario the market often follows.
-
Confirmation to Watch: A decisive break below a key technical support level would validate the FIIs’ bearish stance and could trigger a cascade of stop-loss selling from the trapped retail longs, leading to a waterfall decline.
Conclusion:
The data from August 12th paints an ominous picture of escalating risk. The extreme and aggressive short-building by FIIs, confirmed by rising open interest, has created a highly precarious situation. The market is now a tinderbox, and the risk of a sharp, downward move is exceptionally high. The institutional players have made their bearish conviction clear, and any bullish positions are now fighting a formidable and growing institutional tide.
The Green Light Effect: Why Markets Rally When Planets Go Direct
Last Analysis can be read here
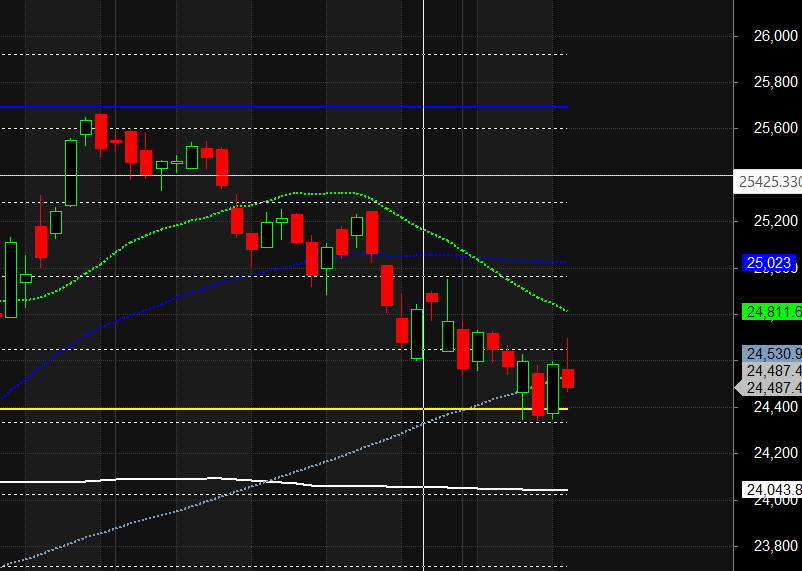
The Nifty is currently wound up like a coiled spring, positioned for a significant upward move. A powerful bullish narrative is being fueled by blockbuster domestic inflation data, which has plunged to an 8-year low, and favorable geopolitical tailwinds from the US. The market has respected the key Mercury Direct low and is showing signs of being oversold, creating a strong underlying foundation. However, the bulls have yet to deliver the final knockout punch by securing a decisive close above the key resistance zone of 24555-24649. This technical hurdle is the only thing holding the market back from a potentially explosive short-covering rally.
1. The Fundamental Fuel: A Game-Changing Inflation Report
The single most powerful catalyst for the bulls is the stunningly low domestic inflation print.
-
India’s CPI at 1.55%: This is not just a good number; it’s a game-changer. An 8-year low in retail inflation gives the Reserve Bank of India (RBI) an enormous amount of flexibility and a strong justification to adopt a more dovish monetary policy. This dramatically increases the odds of future interest rate cuts.
-
Market Impact: Lower interest rates are unequivocally positive for equities, as they reduce the cost of borrowing for companies and make fixed-income instruments less attractive, driving capital towards the stock market. This news provides a powerful fundamental reason for the market to rally.
2. The Geopolitical Tailwind: A Dovish Push from the US
Adding to the positive sentiment is the renewed call from former President Trump for the US to cut rates.
-
Positive for Emerging Markets: A lower interest rate environment in the US typically weakens the dollar and encourages capital to flow into higher-growth emerging markets like India in search of better returns. This creates a favorable global backdrop for a rally in the Nifty.
3. The Technical Foundation: A Resilient but Hesitant Market
The technical picture is one of resilience and a “building cause” for a rally, but it lacks the final confirmation.
-
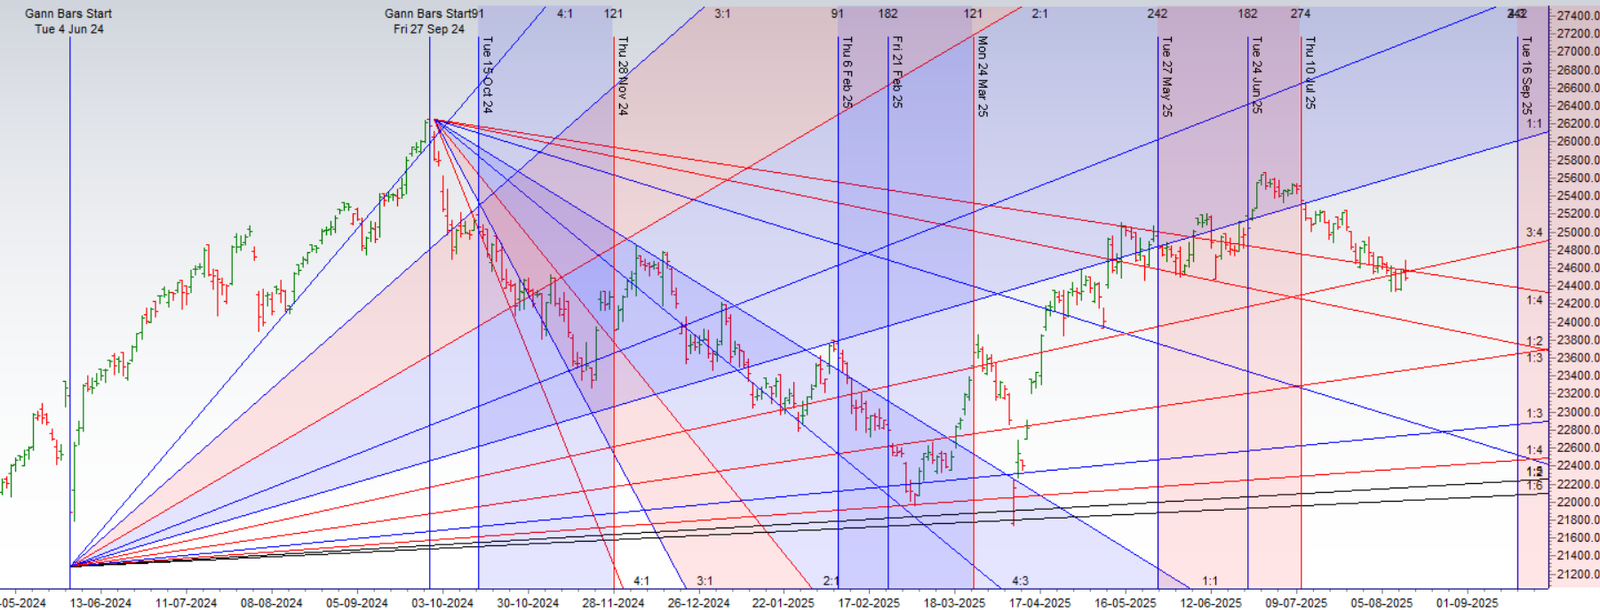
Holding the “Mercury Direct Low”: This is a critical technical achievement. The fact that the market has not breached the low made on the day of the Mercury Direct station indicates that the bullish reversal signal from that day remains valid and is acting as a strong floor for the market.
-
“Quietly Oversold”: After a period of decline, the market being in an oversold state means that selling pressure is likely exhausted. There are fewer sellers left, and it takes less buying pressure to initiate a significant bounce.
-
The Wall of Resistance (24555-24649): This is the key bearish obstacle. While the Nifty managed to make a “higher high” intraday—a sign of bullish intent—it failed to close above 24649. This shows that bears are still actively defending this territory.
4. The Trading Plan: The Starting Gun for a Short Squeeze
The entire setup now hinges on a clear technical trigger. The conditions are ripe for a short-covering rally, but the market needs a definitive signal to start it.
-
The Trigger: A decisive close above 24555. This is the key level that will confirm the bulls have absorbed the selling pressure at resistance and are ready to take control. A close above the higher level of 24649 would be an even stronger confirmation.
-
The Outcome (The Short Covering Rally): Once this trigger is hit, bears who have shorted the market near this resistance zone will be forced to buy back their positions to limit their losses. This forced buying creates a powerful, self-fueling upward spiral known as a short squeeze, which can lead to a very sharp and fast rally.
Conclusion:
The market is presented with a clear and compelling bullish fundamental story but is currently stalled by a technical roadblock. The combination of historic low inflation and a favorable global backdrop provides every reason for the Nifty to rally. The resilience at the Mercury Direct low shows the foundation is strong. All that is missing is the technical confirmation—a firm close above 24555. Once that happens, it will likely act as the starting gun for the major short-covering rally that the underlying conditions so strongly support.
Nifty Trade Plan for Positional Trade ,Bulls will get active above 24578 for a move towards 24656/24734/24812. Bears will get active below 24500 for a move towards 24422/24344
Traders may watch out for potential intraday reversals at 09:28,10:26,11:54,01:03,02:26 How to Find and Trade Intraday Reversal Times
Nifty Aug Futures Open Interest Volume stood at 1.70 lakh cr , witnessing addition of 0.97 Lakh contracts. Additionally, the increase in Cost of Carry implies that there was addition of SHORT positions today.
Nifty Advance Decline Ratio at 19:31 and Nifty Rollover Cost is @24887 closed below it.
Nifty Gann Monthly Buy Level : 24887
Nifty Gann Monthly Sell Level : 24582
Nifty has closed above its 100 SMA @ 24530 Trend is Buy on dips till above 24389
Nifty options chain shows that the maximum pain point is at 24600 and the put-call ratio (PCR) is at 0.65.Typically, when the PCR open interest ranges between 0.90 and 1.05, the market tends to remain range-bound.
Nifty 50 Options Chain Analysis
The Nifty 50 options chain indicates that the highest open interest (OI) on the call side is at the 24600 strike, followed by 24700 strikes. On the put side, the highest OI is at the 24500 strike, followed by 24400 strikes. This suggests that the market participants are expecting Nifty 50 to remain range between 24400-24700 levels.
Retail Euphoria Hits Dangerous Levels as FIIs Step Back
The latest options market data reveals a striking and potentially perilous divergence in market sentiment. Retail traders have thrown caution to the wind, initiating a massive, broad-based bet on a continued market rally. In stark contrast, Foreign Institutional Investors (FIIs) have adopted a highly cautious and defensive posture, choosing to de-risk and sell calls rather than participate in the bullish fervor. This classic standoff between retail euphoria and institutional skepticism has created a tense and vulnerable market environment.
Retail’s All-In Bullish Frenzy
The activity from the retail segment is a clear signal of rampant optimism. Their actions are not just bullish; they represent a high-conviction belief in significant further upside.
-
Massive Call Buying: Retail traders added a net 181,000 long Call option contracts (691K long vs. 510K short). This is a direct and aggressive bet on a market rally, indicating they expect prices to move substantially higher.
-
Selling Puts with Confidence: Simultaneously, they demonstrated their belief that the downside is limited by being net sellers of Put options. By selling more puts than they bought, they are collecting premium and effectively betting that the market will not see a significant decline.
This dual strategy of buying calls and selling puts is an “all-in” bullish stance. It shows that retail is not just hoping for a rally but is actively betting against the possibility of a fall.
FIIs’ Strategic and Cautious Stand
While retail traders were buying, FIIs were taking a markedly different and more strategic approach. Their actions were not bearish, but they were certainly not bullish; they were defensive.
-
Selling Calls to Cap the Upside: The most significant new activity from FIIs was being net sellers of Call options (adding 57.4K short vs. 36.7K long). By selling calls, they are collecting the high premiums fueled by retail optimism. This strategy profits if the market moves sideways or down, and it implies a strong belief that any potential rally will be capped and is unlikely to be explosive.
-
Closing Put Positions (De-Risking): In the Put options, FIIs were net coverers of their positions. This general reduction in exposure is a de-risking move, suggesting they are reducing their directional bets ahead of potential volatility rather than adding new ones.
Market Outlook: A Contrarian Warning Signal
The data paints a classic and often cautionary picture. We have a market where retail enthusiasm is at a fever pitch, providing the liquidity and high premiums that institutions are happily taking the other side of. The massive open interest being built by retail on the long side represents potential “fuel” for a correction. If the market were to turn lower, a cascade of stop-losses from these freshly opened retail long positions could accelerate the decline.
The FIIs are not fighting the market; they are simply refusing to participate in the euphoria. Their strategy of selling calls and reducing exposure is a quiet but clear vote of no-confidence in a continued, strong rally. This divergence is a significant warning flag for bulls and suggests that the market is now in a vulnerable and precarious position.
In the cash segment, Foreign Institutional Investors (FII) sold 3398 cr , while Domestic Institutional Investors (DII) bought 3507 cr.
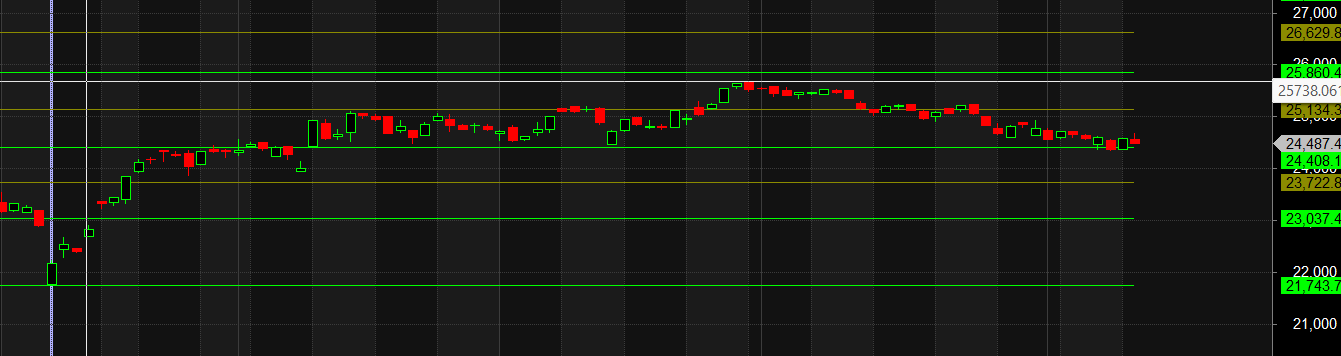
Traders who follow the musical octave trading path may find valuable insights in predicting Nifty’s movements. According to this path, Nifty may follow a path of 23037-23722-24408-25134-25860 This means that traders can take a position and potentially ride the move as Nifty moves through these levels.Of course, it’s important to keep in mind that trading is inherently risky and market movements can be unpredictable.
Doubling down does not work for the intraday trader. I have tried it. Eighty-five percent of the time you will profit when you double down. But the 15 percent of the time you are wrong, you will get smoked. The losses during these trades will far outweigh the gains from the 85%
For Positional Traders, The Nifty Futures’ Trend Change Level is At 24665 . Going Long Or Short Above Or Below This Level Can Help Them Stay On The Same Side As Institutions, With A Higher Risk-reward Ratio. Intraday Traders Can Keep An Eye On 24652, Which Acts As An Intraday Trend Change Level.
Nifty Intraday Trading Levels
Buy Above 24555 Tgt 24585, 24630 and 24690 ( Nifty Spot Levels)
Sell Below 24512 Tgt 24484, 24430 and 24400 (Nifty Spot Levels)
Wishing you good health and trading success as always.As always, prioritize your health and trade with caution.
As always, it’s essential to closely monitor market movements and make informed decisions based on a well-thought-out trading plan and risk management strategy. Market conditions can change rapidly, and it’s crucial to be adaptable and cautious in your approach.
► Join Youtube channel : Click here
► Check out Gann Course Details: W.D. Gann Trading Strategies
► Check out Financial Astrology Course Details: Trading Using Financial Astrology
► Check out Gann Astro Indicators Details: Gann Astro Indicators