


Market Analysis: FIIs Go “All In” on Bearish Bets, Setting Up a Perilous Showdown with Retail Bulls
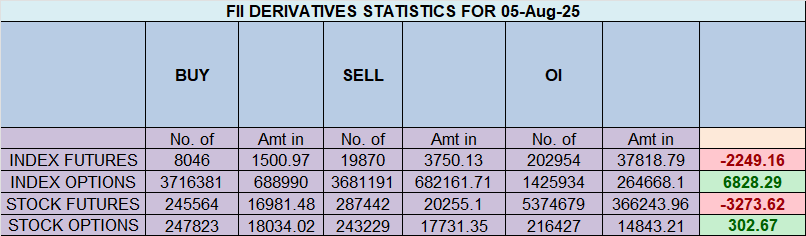
The derivative data from August 5th reveals one of the most extreme and alarming divergences between Foreign Institutional Investors (FIIs) and retail clients seen in recent history. FIIs have aggressively intensified their bearish conviction, pushing their long-to-short ratio to a perilously low 08:92. This indicates they are overwhelmingly positioned for a significant market downturn. In a classic “smart money vs. retail” showdown, clients have taken the opposite side, doubling down on their bullish bets. The surge in Open Interest confirms that this is not just a reshuffling of old positions but a fresh, high-stakes battle being initiated. This setup serves as a major red flag for bulls and suggests the market is extremely vulnerable to a sharp, downward move.
1. FII Activity: A Roaring Bearish Signal
The actions of FIIs on this day were not just bearish; they were a powerful statement of intent.
-
Massive Short Buildup: FIIs added a staggering 11,684 new short contracts while covering an insignificant 140 long contracts. This is not hedging. This is an aggressive, high-conviction directional bet that the market is going to fall significantly.
-
Net Impact: The net activity of shorting 5,047 contracts worth 934 crore confirms a substantial flow of institutional money towards bearish positions.
Decoding the FII Positioning:
The most critical takeaway is the current positioning ratio of 08:92 (or 0.09). This is an extremely rare and dangerous level of institutional pessimism. It means that for every single contract FIIs are holding for a potential upside, they are holding more than eleven contracts betting on a downside. This is not caution; it is a near-maximalist bearish stance. When institutional players, with their vast research capabilities, align this aggressively on one side of the trade, it often precedes a significant market event.
2. Client Behavior: The Unwavering Bull
Retail clients have positioned themselves as the polar opposite of the FIIs, displaying a powerful bullish conviction.
-
Aggressive Long Additions: Clients added 8,468 new long contracts, indicating a strong belief that the market has bottomed or is about to rally. They are actively “buying the dip” and betting against the institutional sentiment.
-
Overall Stance: Their long/short ratio of 70:30 (or 2.33) reflects deep-seated optimism. They are holding more than two long contracts for every one short contract.
This creates a perfect, high-tension standoff. While retail sentiment can sometimes be correct, it is historically a dangerous game to fight institutional momentum when the conviction level is this high.
3. The Critical Clue: Rising Open Interest (OI)
The net increase in Open Interest by 4,523 contracts is a crucial piece of the puzzle.
-
What it means: A rise in OI signifies that new money is flowing into the market and new positions are being created. It confirms that this is not just traders closing old positions but a fresh, high-stakes battle being initiated.
-
The Bearish Interpretation: In this specific context, the OI increase was fueled by fresh shorts from FIIs and fresh longs from Clients. An increase in OI, especially when the institutional players are building massive short positions, is a strongly bearish signal. It indicates that the “smart money” is actively building positions for a decline, and the market is absorbing these new shorts, which increases its vulnerability.
Market Outlook and Strategic Implications
-
Primary Scenario (High Probability): Significant Downside Risk. The overwhelming bearish conviction of FIIs cannot be ignored. The market is extremely susceptible to a sharp sell-off. Any minor bounce is likely to be met with aggressive selling by institutions, creating a “bull trap” for the heavily long retail segment.
-
Confirmation to Watch: A break below the day’s low or a key support level could act as the trigger. This would activate a cascade of stop-loss orders from the retail longs, leading to accelerated, panic-driven selling.
-
The Path of Maximum Pain: With retail so heavily long, a sharp decline would cause the most financial pain to the largest number of participants, a scenario the market often follows.
Conclusion:
The data paints one of the clearest bearish pictures possible. The extreme, high-conviction short-building by FIIs against a backdrop of retail optimism is a classic warning signal of an impending downturn. The risk-reward is heavily skewed to the downside. Bulls should exercise extreme caution, as the institutional weight on the short side is now immense and poses a clear and present danger to any long positions. The stage is set for a volatile period, with a high probability of a downward resolution.
Mindful Trading: How to Stay Calm Under Market Pressure
Last Analysis can be read here
The market’s bearish momentum was confirmed today with a decisive fall, validating the prevailing downtrend and bringing the Nifty to a critical inflection point. The bears are now in firm control, pushing the index towards the psychological precipice of 24500. The market is now caught in a high-stakes, two-front war: an immediate, binary threat from a potential US tariff announcement and a crucial domestic policy decision from the Reserve Bank of India (RBI) on Wednesday. The technical lines are clearly drawn, with the 24529-24555 zone serving as the last line of defense for bulls against a potential waterfall decline.
1. The Bearish Case Solidified: Today’s “Perfect Fall”
Today’s price action was not just a minor dip; it was a textbook continuation of the bearish structure. The fall confirmed that the path of least resistance is currently downwards and that any minor rallies are being aggressively sold into. This has emboldened the bears and pushed the bulls into a defensive corner, making the support levels outlined below absolutely critical for the market’s short-term survival.
2. The Two-Front War: Global Threats and Domestic Hopes
The market is currently being held hostage by two major, impending events that will dictate the next directional move.
-
The Immediate Threat: US Tariff Verdict (Next 24 Hours): The looming threat of new tariffs from the US, with a decision expected within 24 hours, is the single biggest source of overnight risk.
-
Negative Outcome: If tariffs are announced, it would serve as a powerful catalyst for a global risk-off move, likely causing the Nifty to gap down and decisively break the key 24500 support level.
-
Positive Outcome: If the tariff threat is averted, it could provide a temporary sigh of relief, but the market’s focus would immediately shift to the RBI policy.
-
-
The Domestic Wild Card: RBI MPC Meeting (Wednesday, Aug 6): The RBI’s policy decision is the next major hurdle. The central bank faces a delicate balancing act between managing inflation and supporting growth in a volatile global landscape. While the consensus may be leaning towards a pause, the possibility of a surprise move creates significant uncertainty.
3. The Technical Battleground: Scenarios and Key Levels
The market’s future is now defined by a clear set of technical levels. How the Nifty reacts to these zones in response to the upcoming triggers will determine the next leg of the trend.
-
The Bullish Scenario (The Last Stand): For the bulls to have any hope of reclaiming control, they must defend the critical support zone of 24529-24555.
-
The Catalyst: Their only realistic path to a rally lies in a surprise rate cut by the RBI on Wednesday. Such a move would be unexpected and could inject a powerful dose of positive sentiment into the market.
-
The Outcome: A surprise cut, combined with holding the 24529-24555 support, could trigger a massive short-covering rally, as the heavily positioned bears would be forced to abandon their bets in a hurry.
-
-
The Bearish Scenario (The Path of Least Resistance): This scenario aligns with the current market momentum.
-
The Trigger: A breakdown and close below the crucial psychological level of 24500. This could be initiated by a negative tariff announcement or a hawkish/neutral stance from the RBI that disappoints the market.
-
The Outcome: A decisive breach of 24500 would validate the bears’ dominance and is expected to lead to a quick and sharp decline towards the next major support level at 24389. This would represent a classic continuation of the downtrend.
-
Conclusion:
The Nifty is in a precarious position. The bears have the clear upper hand, backed by strong momentum. The market’s immediate fate rests on the tariff news, which could easily trigger the bearish scenario. The bulls’ hopes are pinned on a dovish surprise from the RBI, but they must first survive the next 24 hours and hold the critical 24529 support zone. Traders should prepare for extreme volatility and recognize that the market is currently reactive, waiting to be pushed in one direction or the other by these powerful external events. The battle for 24500 is on.
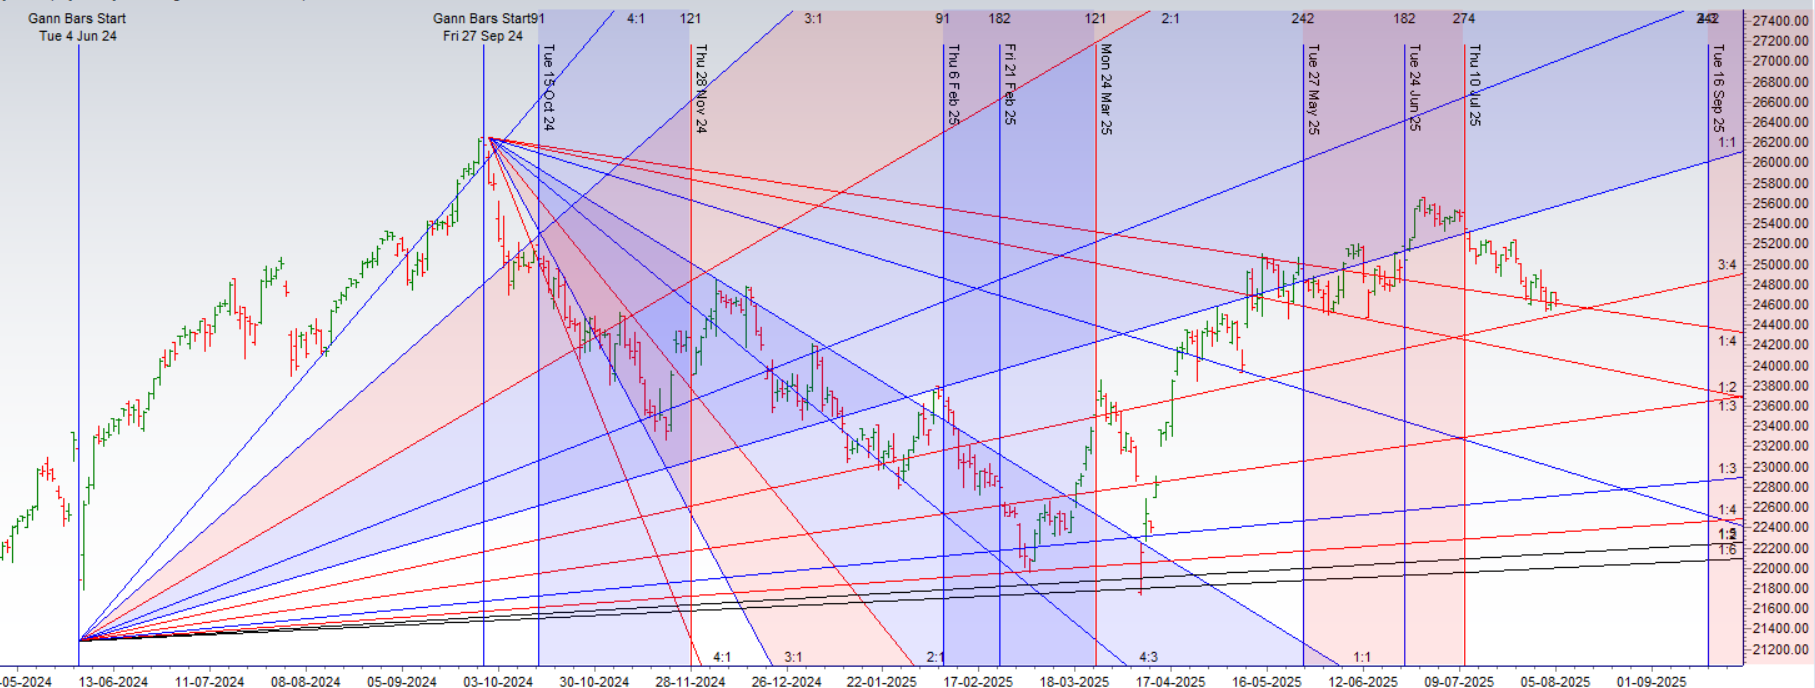
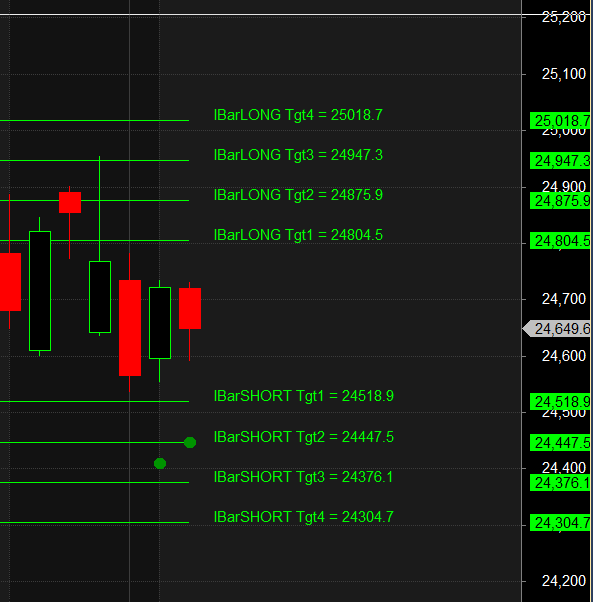
Nifty Trade Plan for Positional Trade ,Bulls will get active above 24740 for a move towards 24804/24875/24947. Bears will get active below 24590 for a move towards 24518/24447/24376
Traders may watch out for potential intraday reversals at 09:47,10:31,12:42,02:04 How to Find and Trade Intraday Reversal Times
Nifty Aug Futures Open Interest Volume stood at 16.6 lakh cr , witnessing addition of 1 Lakh contracts. Additionally, the increase in Cost of Carry implies that there was addition of SHORT positions today.
Nifty Advance Decline Ratio at 25:25 and Nifty Rollover Cost is @24887 closed below it.
Nifty Gann Monthly Buy Level : 24887
Nifty Gann Monthly Sell Level : 24582
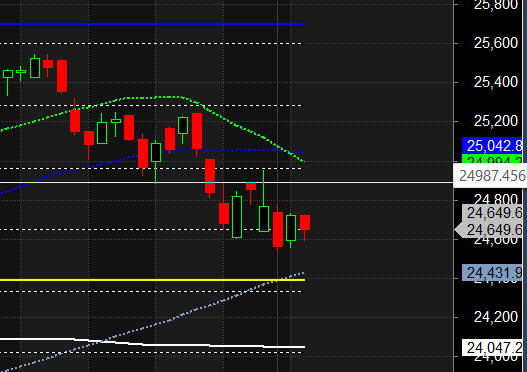
Nifty has closed below its 100 SMA @ 24994 Trend is Sell on Rise till below 25100
Nifty options chain shows that the maximum pain point is at 24700 and the put-call ratio (PCR) is at 0.72.Typically, when the PCR open interest ranges between 0.90 and 1.05, the market tends to remain range-bound.
Nifty 50 Options Chain Analysis
The Nifty 50 options chain indicates that the highest open interest (OI) on the call side is at the 24800 strike, followed by 25000 strikes. On the put side, the highest OI is at the 24500 strike, followed by 24300 strikes. This suggests that the market participants are expecting Nifty 50 to remain range between 24300-24600 levels.
Retail Euphoria Clashes with FII Caution in High-Stakes Options Game
The latest options market data reveals a dramatic and dangerous divergence in sentiment, painting a classic picture of unbridled retail optimism colliding with quiet institutional caution. While retail traders are aggressively placing high-conviction bets on a significant market rally, Foreign Institutional Investors (FIIs) are subtly buying protection, preparing for potential turmoil. This stark disagreement has created a tense, high-stakes environment where one side is set to be proven decisively wrong.
Retail’s Bullish Rampage
The activity from the retail segment is not just bullish; it is a full-throated roar of optimism. Their strategy is two-pronged and aggressive:
-
Betting on the Upside: Retail traders added a massive 383,000 long Call option contracts. This is a direct and substantial bet on a strong market rally, far outweighing the 257,000 short Calls they covered. The net effect is a significant increase in their exposure to potential gains.
-
Betting Against a Downside: Simultaneously, they are showing confidence that the market will not fall by shorting more Put options than they bought. Selling Puts is essentially underwriting insurance for others, a strategy that profits if the market remains stable or moves higher.
This combination of aggressively buying Calls and cautiously selling Puts demonstrates an extremely high level of conviction. Retail traders are not just hoping for a rally; they are actively betting against the possibility of a decline.
FII’s Quietly Hedging Bets
In stark contrast, the “smart money” played a far more nuanced and defensive game. Their actions suggest they are not convinced by the bullish narrative and are instead preparing for volatility.
-
The Key Defensive Move: The most significant action taken by FIIs was the addition of 50,000 new long Put contracts. Buying Puts is the clearest way to hedge a portfolio or place a direct bet on a market fall. This move to buy “insurance” overshadows all their other activity.
-
Muted Bullish Activity: While FIIs did add 43,000 long Calls, this number is dwarfed by retail’s bullish bets and is largely offset by their own defensive Put buying. Their net activity is not one of confident buying but of strategic preparation for a potential downturn.
In the cash segment, Foreign Institutional Investors (FII) sold 22 cr , while Domestic Institutional Investors (DII) bought 3840 cr.
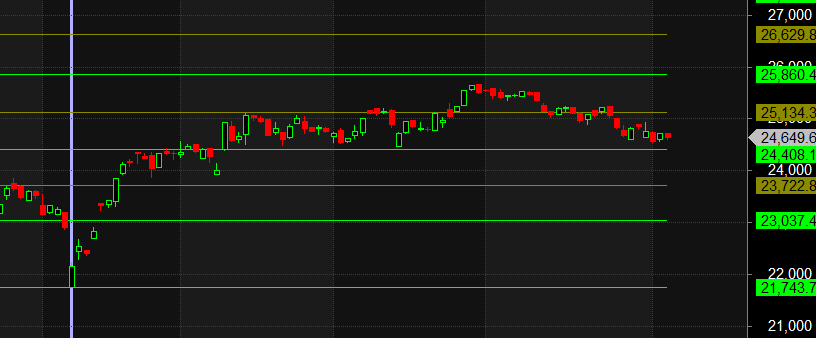
Traders who follow the musical octave trading path may find valuable insights in predicting Nifty’s movements. According to this path, Nifty may follow a path of 23037-23722-24408-25134-25860 This means that traders can take a position and potentially ride the move as Nifty moves through these levels.Of course, it’s important to keep in mind that trading is inherently risky and market movements can be unpredictable.
When you really believe that trading is simply a probability game, concepts like right or wrong or win or lose no longer have the same significance.
For Positional Traders, The Nifty Futures’ Trend Change Level is At 24761. Going Long Or Short Above Or Below This Level Can Help Them Stay On The Same Side As Institutions, With A Higher Risk-reward Ratio. Intraday Traders Can Keep An Eye On 24698, Which Acts As An Intraday Trend Change Level.
Nifty Intraday Trading Levels
Buy Above 24610 Tgt 24648, 24680 and 24729 ( Nifty Spot Levels)
Sell Below 24580 Tgt 24529, 24496 and 24439 (Nifty Spot Levels)
Wishing you good health and trading success as always.As always, prioritize your health and trade with caution.
As always, it’s essential to closely monitor market movements and make informed decisions based on a well-thought-out trading plan and risk management strategy. Market conditions can change rapidly, and it’s crucial to be adaptable and cautious in your approach.
► Join Youtube channel : Click here
► Check out Gann Course Details: W.D. Gann Trading Strategies
► Check out Financial Astrology Course Details: Trading Using Financial Astrology
► Check out Gann Astro Indicators Details: Gann Astro Indicators