


FIIs Unleash ₹845 Crore Bearish Assault on Nifty, Pushing Positioning to Extreme Levels
In the relentless tug-of-war between market bulls and bears, some days are mere skirmishes, while others are declarations of war. Today’s data from the Nifty Index Futures market falls firmly into the latter category. Foreign Institutional Investors (FIIs) have moved beyond mere caution and have launched a full-scale bearish assault, deploying massive capital to short the market with a level of conviction that demands every trader’s attention.
They net shorted a staggering 4,469 contracts, translating to a monumental ₹845 crore bet against the Nifty. This wasn’t a quiet rebalancing; it was a loud, clear, and aggressive statement.
This move has pushed the market’s underlying structure to a precarious extreme, setting the stage for a period of intense volatility. Let’s dissect the data to understand why this is more than just another day of selling.
The FII Playbook: All Gas, No Brakes on the Bearish Side
To grasp the sheer force of the FIIs’ conviction, we must look beyond the net shorting figure and into the breakdown of their activity. It reveals a stunningly one-sided strategy.
-
They added a massive 3,354 new short contracts. This is the core of their action. They are actively and aggressively initiating new bets that the market is headed for a downturn.
-
They covered only 338 long contracts. This is an almost negligible number. It tells us that FIIs are not de-risking by selling their existing bullish positions. Instead, their primary action was to hammer the short side.
This is the very definition of a high-conviction bearish attack. The value of this move—₹845 crore—underscores the seriousness of their intent. This is not speculative hedging; it is a significant deployment of capital based on a well-defined negative outlook, likely driven by macroeconomic concerns, earnings forecasts, or global risk factors.
This aggressive shorting has pushed their overall positioning to one of the most extreme levels we’ve seen. With a Long:Short ratio of just 18:82, the FII camp is now overwhelmingly, almost uniformly, bearish. The positional ratio of 0.22 is a stark indicator of their sentiment: for every single contract FIIs hold betting on a market rise, they hold nearly five contracts betting on a fall. This is a five-alarm fire signal from the “smart money.”
Client Behaviour: The Cracks Begin to Show in the Bullish Façade
In stark contrast, the Client segment (largely representing retail traders and HNIs) remains the primary buyer, absorbing the institutional selling pressure. However, for the first time in a while, their bullish conviction is no longer pure.
-
They added 2,691 new long contracts. On the surface, this is bullish. They continue to believe in the market’s upside and are buying into the FIIs’ selling. Their overall Long:Short ratio of 64:36 and a positional ratio of 1.76 still reflect a net bullish stance.
-
However, they also added 1,830 new short contracts. This is a crucial and telling detail. Unlike previous sessions where clients were almost exclusively buying longs and covering shorts, they are now actively adding new bearish bets themselves.
This suggests a significant fragmentation of opinion within the retail camp. While the majority are still buying, a growing and substantial minority are either turning bearish or are hedging their new long positions out of fear. The unwavering optimism is beginning to crack. This internal conflict is often a precursor to a sentiment shift.
The Open Interest Amplifier: More Fuel on the Fire
The most critical piece of this puzzle is the net open interest (OI) increase of 3,509 contracts.
As we know, an increase in OI signifies that new money and new positions are entering the market. This massive OI build-up confirms that today’s activity was not a simple rotation of positions. It was a major escalation. Fresh, high-conviction capital poured into the market on both sides:
-
FIIs brought in new money to aggressively short the market.
-
Clients brought in new money to aggressively long the market.
The market has become a pressure cooker. Both sides are not just holding their ground; they are actively pushing against each other with fresh force. This build-up of opposing open interest is the fuel that can power a sharp, violent, and sustained move once a key level breaks.
Conclusion: A Market on the Brink
The data from July 16th is one of the most unambiguous bearish signals from FIIs in recent memory. They are not just cautious; they are on the attack, and they are backing their view with nearly a billion dollars in a single session.
Here’s the takeaway for every trader:
-
The FII Signal is Overwhelming: An 18:82 positioning ratio is an extreme that cannot be ignored. The “smart money” is positioned for a significant downside move. Fighting this sentiment is like swimming against a powerful riptide.
-
Retail Conviction is Fracturing: While still net bullish, the addition of a large number of short positions by clients indicates that the bullish consensus is breaking down. This weakens the market’s underlying support.
-
Expect Extreme Volatility: The massive build-up in open interest has coiled the market like a spring. A break of a key support or resistance level is likely to trigger a sharp, accelerated move as one side is forced to liquidate their positions in a panic.
We are no longer in a simple bull vs. bear scenario. We are witnessing a high-conviction institutional assault against a still-hopeful, but increasingly nervous, retail public. The risk of a sudden and severe market decline has increased dramatically. This is a time for extreme caution, diligent risk management, and a deep respect for the clear and present danger signaled by the institutional giants.
The Silent Account Killer: How Stress Sabotages Your Trading and the Strategies to Fight Back
Last Analysis can be read here
The market is speaking, but its language is one of profound indecision. For the second consecutive day, the Nifty has carved a Doji candle on the chart—a classic symbol of a stalemate, a perfect equilibrium between the forces of buying and selling. But this is not a sign of weakness; it’s the sign of a market holding its breath, coiled like a spring before a series of blockbuster events that are set to define the next major trend.
While the action feels range-bound and frustrating, the underlying message is one of incredible bullish resilience at a critical juncture. The bulls have drawn a fortress at a key astrological support level and are now fighting to control the narrative into tomorrow’s weekly expiry.
Let’s dissect the components of this great market standoff to understand why the current paralysis is likely the calm before a violent storm.
The Bulls’ Fortress: Defending the Saturn High at 25151
The most significant development of the past two sessions is not what the market did, but what it didn’t do. Despite attempts by sellers to push the market lower, the bulls have successfully defended the crucial astro-technical level of 25151.
This isn’t just any support level. It represents the high established during the recent Saturn Retrograde period. In financial astrology, successfully holding this level after a breakout is a sign of immense strength. It confirms that the breakout was genuine and that the “cosmic ceiling” has now been converted into a solid support floor. The formation of a Doji candle above this level is a powerfully bullish signal. It indicates that every selling attempt was absorbed by determined buyers, resulting in a stalemate at a higher ground.
The Gravitational Pull of the Weekly Expiry
Adding another layer to this tense drama is the dynamic of tomorrow’s weekly options expiry. The previous expiry settled around 25355. This level now acts as a form of “price gravity,” a psychological magnet pulling the market towards it.
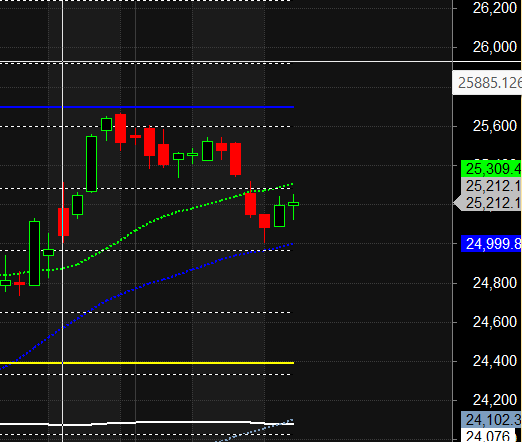
Today’s close around 25212 places the market in a fascinating position. The bulls have a clear objective for tomorrow’s session: to orchestrate a close in the 25330-25355 range. Achieving this would not only signify a strong end to the week but would also form a perfect “expiry Doji” on the weekly chart. This would represent a full week of intense, volatile trading that ultimately resolves into a state of balance—a perfect pause before the market digests the weekend’s news.
The Weekend Juggernauts: Why the Market is Holding Its Breath
So, why is the market stuck in this tight range despite the bullish defense of 25151? The answer lies on the event horizon: this weekend, the three titans of the Indian market are all set to announce their quarterly results.
-
ICICI Bank
-
HDFC Bank
-
Reliance Industries
These three companies are not just stocks; they are the pillars of the Nifty. Their combined weight can single-handedly dictate the direction of the entire index. No major institutional player—bull or bear—is willing to place a large, unhedged bet just hours before these market-moving announcements. The risk of being on the wrong side of a major earnings surprise from any one of these giants, let alone all three, is simply too great.
This is the primary reason for the market’s current state of paralysis. The Doji candles are a visual representation of institutional players pulling their bids and offers, stepping back from the field, and waiting for the dust to clear.
The Cosmic X-Factor: Mercury Retrograde Looms
As if the earnings of the three biggest companies weren’t enough, another major catalyst is approaching: Mercury Retrograde. In astro-finance, these periods are notorious for bringing confusion, miscommunication, volatile swings, and unexpected reversals.
It’s the perfect cosmic backdrop for the market to react to the weekend’s earnings news. The market is likely to remain in this holding pattern until the results are out. Then, under the chaotic and unpredictable influence of Mercury Retrograde, it will begin to price in the new information. This could lead to a sharp, high-momentum trend that may not follow the most logical path, making the post-results trading environment particularly treacherous.
Conclusion
The Nifty is currently in the eye of a perfect storm. The market is not weak; it is waiting. The back-to-back Doji candles are a sign of a rational pause, not a loss of bullish momentum. The bulls have proven their strength by holding the critical 25151 support, and their immediate goal is to guide the weekly expiry towards the 25355 zone.
However, the real game begins after the closing bell on Friday. The combined earnings of HDFC Bank, ICICI Bank, and Reliance will provide the fundamental trigger, while the impending Mercury Retrograde will provide the volatile and unpredictable environment for the market’s reaction. Traders should be prepared for a significant increase in volatility next week, as this period of tense calm finally gives way to a decisive and powerful move.
Nifty Trade Plan for Positional Trade ,Bulls will get active above 25239 for a move towards 25318/25397. Bears will get active below 25081 for a move towards 25001/24920
Traders may watch out for potential intraday reversals at 09:45,11:32,01:22, 02:26 How to Find and Trade Intraday Reversal Times
Nifty July Futures Open Interest Volume stood at 13.6 lakh cr , witnessing liquidation of 0.38 Lakh contracts. Additionally, the increase in Cost of Carry implies that there was closure of LONG positions today.
Nifty Advance Decline Ratio at 20:29 and Nifty Rollover Cost is @24321 closed above it.
Nifty Gann Monthly Buy Level : 25709
Nifty Gann Monthly Sell Level : 25393
Nifty has closed above its 20 SMA @ 25268 Trend is Sell on Rise till below 25393.
Nifty options chain shows that the maximum pain point is at 25200 and the put-call ratio (PCR) is at 0.81 .Typically, when the PCR open interest ranges between 0.90 and 1.05, the market tends to remain range-bound.
Nifty 50 Options Chain Analysis
The Nifty 50 options chain indicates that the highest open interest (OI) on the call side is at the 25400 strike, followed by 25500 strikes. On the put side, the highest OI is at the 25200 strike, followed by 25100 strikes. This suggests that the market participants are expecting Nifty 50 to remain range between 25200-25500 levels.
In the cash segment, Foreign Institutional Investors (FII) sold 1858 cr , while Domestic Institutional Investors (DII) bought 1223 cr.
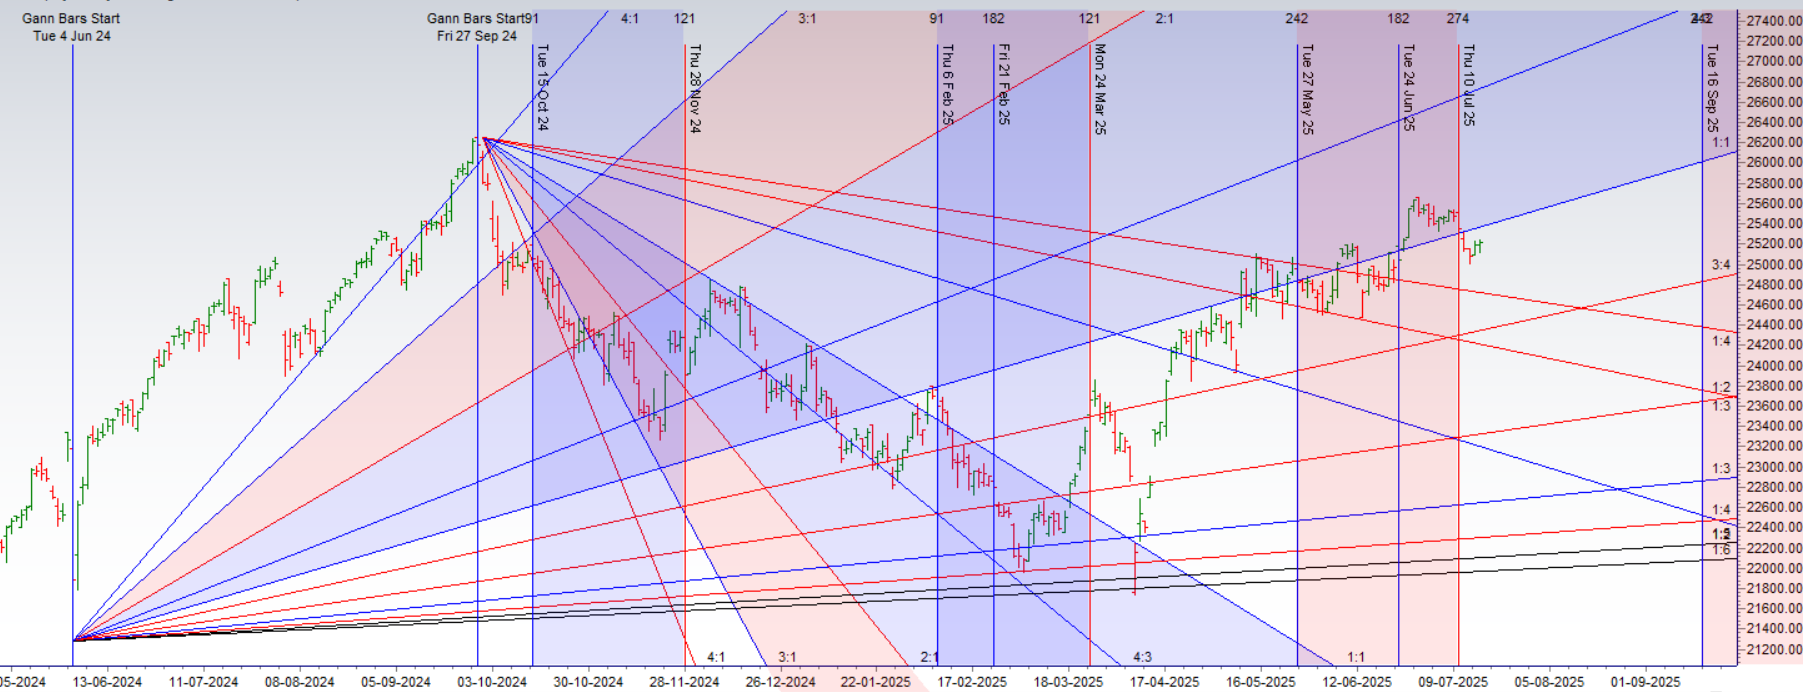
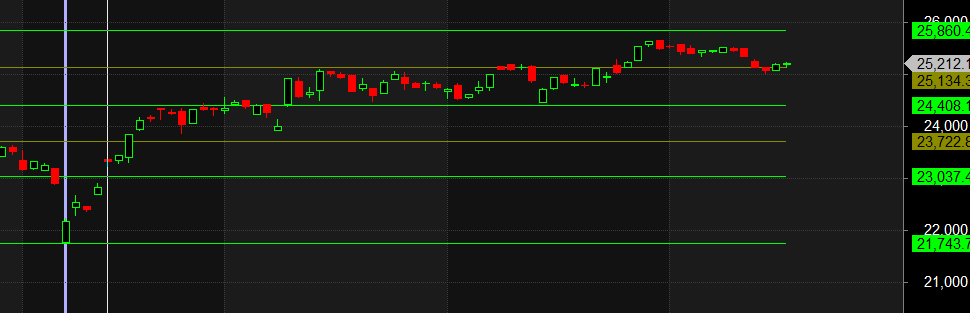
Traders who follow the musical octave trading path may find valuable insights in predicting Nifty’s movements. According to this path, Nifty may follow a path of 23037-23722-24408-25134-25860 This means that traders can take a position and potentially ride the move as Nifty moves through these levels.Of course, it’s important to keep in mind that trading is inherently risky and market movements can be unpredictable.
Don’t trade on emotion. Trading is a numbers game, and it’s important to make decisions based on logic and analysis, not emotion.
For Positional Traders, The Nifty Futures’ Trend Change Level is At 25480 . Going Long Or Short Above Or Below This Level Can Help Them Stay On The Same Side As Institutions, With A Higher Risk-reward Ratio. Intraday Traders Can Keep An Eye On 25223 , Which Acts As An Intraday Trend Change Level.
Nifty Expiry Range
Upper End of Expiry : 25360
Lower End of Expiry : 25064
Nifty Intraday Trading Levels
Buy Above 25250 Tgt 25285, 25323 and 25360 ( Nifty Spot Levels)
Sell Below 25196 Tgt 25166, 25133 and 25085 (Nifty Spot Levels)
Wishing you good health and trading success as always.As always, prioritize your health and trade with caution.
As always, it’s essential to closely monitor market movements and make informed decisions based on a well-thought-out trading plan and risk management strategy. Market conditions can change rapidly, and it’s crucial to be adaptable and cautious in your approach.
► Join Youtube channel : Click here
► Check out Gann Course Details: W.D. Gann Trading Strategies
► Check out Financial Astrology Course Details: Trading Using Financial Astrology
► Check out Gann Astro Indicators Details: Gann Astro Indicators