FIIs Fire a ₹186 Crore Warning Shot: Why a Small Move in Bank Nifty Futures Speaks Volumes
In the daily deluge of market data, it’s easy to get lost in the noise. A thousand-point rally in the Nifty or a viral tweet can capture all the attention, while the subtle, more telling moves of institutional players can go unnoticed. Today, in the Bank Nifty Index Futures market, we saw one such move—a move that, while seemingly small in contract terms, carries a weight of conviction worth ₹186 crore and signals a significant red flag for the market’s most critical sector.
Foreign Institutional Investors (FIIs) have been telegraphing their caution for a while, but their latest action sharpens that message into a clear, bearish stance. They net shorted 932 Bank Nifty contracts, a direct bet against the banking index.
On the surface, 932 contracts might not seem like a market-moving number. However, the two pieces of accompanying data transform this from a minor adjustment into a powerful statement of intent: the value of the short positions and the increase in Open Interest.
Decoding the Data: Beyond the Headline Number
Let’s break down what this data is really telling us.
-
The Position: FIIs were net sellers, shorting 932 contracts of Bank Nifty futures.
-
The Capital Deployed: The value of these short positions was a significant ₹186 crore. This isn’t a speculative punt; it’s a substantial allocation of capital expressing a negative view on the banking sector. FIIs don’t deploy this kind of money lightly. It reflects a well-researched, high-conviction thesis.
-
The Crucial Clue: The activity resulted in a net open interest (OI) increase of 682 contracts.
This last point is the key to the entire story.
Open Interest: The True Measure of Conviction
Open Interest (OI) represents the total number of outstanding futures contracts that have not yet been settled. It is the ultimate gauge of market participation and conviction.
-
If OI decreases, it means positions are being closed, and money is leaving the market. Conviction is waning.
-
If OI increases, it means new positions are being created, and fresh money is entering the market. This signals rising conviction.
In this case, the increase of 682 contracts in OI while FIIs were net shorting is profoundly important. It tells us that this wasn’t just a case of one FII selling to another. Instead, FIIs actively created new bearish positions. They didn’t just exit their bullish bets; they doubled down on their bearish ones.
Think of it like a poker game. A decrease in OI is like players folding their hands. An increase in OI is like new players walking up to the table and placing large, fresh bets. The FIIs just placed a fresh ₹186 crore bet that the Bank Nifty is headed down.
Last Analysis can be read here
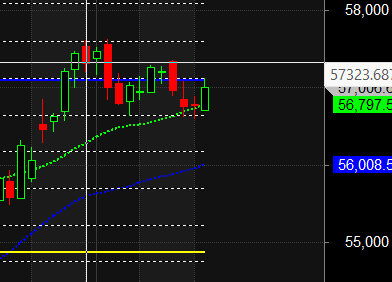
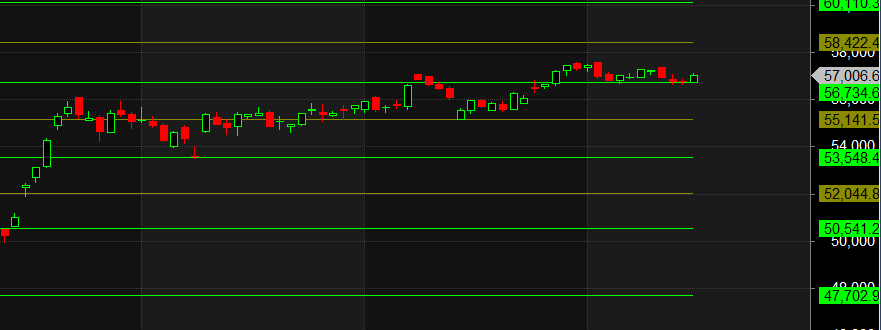
After a period of intense selling that tested the resolve of even the staunchest bulls, the Bank Nifty has just delivered a powerful counter-punch. The market, which had been teetering on the edge, printed a classic Doji candle of indecision, a sign of a potential stalemate between buyers and sellers. But the context of this Doji is everything—it formed precisely on a Saturn Retrograde event, a period astrologically known for forcing reality checks and establishing structural turning points.
Today, the bulls gave a resounding answer to that indecision.
In a remarkable display of strength, the Bank Nifty not only bounced back but managed to achieve a critical technical milestone: it closed decisively above the Saturn Retrograde high of 56896. This is not just a price level; for astro-technical traders, it represents the breaking of a “cosmic ceiling,” a move that has fundamentally shifted the market’s power dynamic.
The Bullish Breakout: Why 56896 is the New Line in the Sand
In financial astrology, Saturn’s energy is one of structure, limitation, and testing. The high point of its retrograde period often acts as a significant barrier—a karmic resistance level that the market must overcome to prove its strength. By closing above 56896, the bulls have effectively:
-
Invalidated the recent bearish pressure.
-
Turned a major resistance level into a critical support floor.
-
Signaled that the path of least resistance has now shifted to the upside.
This breakout establishes a clear and actionable framework for the days ahead. The level of 56896 is now the primary line in the sand for the bulls. As long as the market can hold above this level on a closing basis, the bullish momentum is considered dominant. Any dips towards this level that are met with buying pressure would be seen as a healthy confirmation of the breakout.
With this newfound strength, the bulls have their sights set on the next logical targets: the resistance zones at 57225 and, looking higher, 57555.
The Bears’ Last Stand: The Level That Must Be Broken
While the bulls are currently celebrating, this is no time for complacency. A powerful breakout can sometimes be a “bull trap,” designed to lure in buyers before a swift reversal. For the bears to have any chance of regaining control and proving this rally is fake, they must achieve one specific objective: force a close below 56594.
A break below this level would be a major victory for the bears. It would signify that the breakout above the Saturn high has failed, trapping the recent buyers and likely triggering a sharp, accelerated decline as those positions are liquidated. Until that happens, however, the bears are on the defensive.
The X-Factor: Tomorrow’s Moon Declination and the Coming Volatility
Adding a layer of intense focus to tomorrow’s session is a key astrological event: the Moon Declination. These lunar events are often correlated with a significant spike in market volatility and can act as powerful catalysts, often triggering a sharp, high-momentum trend that can last for a couple of days.
This expected volatility is the perfect setup to test the integrity of the recent breakout. It will force the market to show its true hand—either confirming the bullish strength or exposing it as a fragile trap.
An Actionable Intraday Strategy for Tomorrow
The anticipated volatility from the Moon Declination makes the opening range breakout strategy an ideal tool for intraday traders. It allows the initial chaotic moves to settle and helps traders align with the day’s dominant force.
-
Mark the Range: For the first 15 minutes of the trading session, carefully note the highest and lowest price points the Bank Nifty reaches. This is your opening range.
-
Wait for the Signal: Do not trade within this initial 15-minute zone. Patience is key. Let the market make the first move.
-
Trade the Break:
-
A decisive move above the 15-minute high is a strong bullish signal for the day, suggesting traders can look for long opportunities.
-
A clean break below the 15-minute low indicates the bears have seized control, and short-side trades become the higher probability play.
This method acts as a real-time guide, helping traders to harness the day’s momentum rather than fighting against it.
Conclusion
The Bank Nifty is at a thrilling and critical juncture. The bullish breakout above the Saturn Retrograde high of 56896 has given them a clear technical and psychological advantage. The battle lines are now clearly drawn: bulls must defend 56896, while bears need a decisive break below 56594 to turn the tables.
With the Moon Declination set to inject a powerful dose of energy into the market, tomorrow’s session is poised to be a crucial one. All eyes will be on the opening 15-minute range for the first clue as to whether the bulls are ready to extend their rally towards 57555, or if the bears are about to spring their trap.
Bank Nifty Trade Plan for Positional Trade ,Bulls will get active above 57337 for a move towards 571575/57813/58051. Bears will get active below 57148 for a move towards 56908/56666