


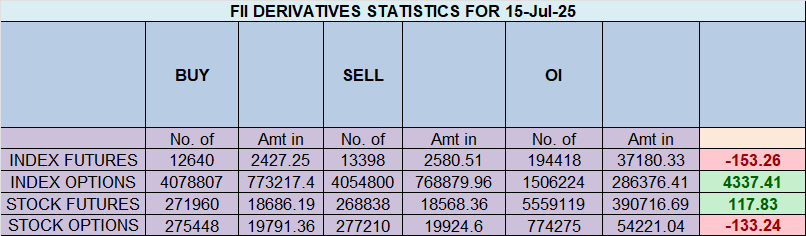
A Deep Dive into the FII vs. Client Standoff in Nifty Futures
In the complex theatre of the stock market, not all participants are created equal. While price and volume are the headline acts, the positioning of different player groups provides a crucial subplot—a narrative of conviction, fear, and conflicting expectations. On July 15th, the data from the Nifty Index Futures segment painted a picture not of consensus, but of a dramatic and deepening divide between two market titans: the Foreign Institutional Investors (FIIs) and the Clients, who largely represent the retail trading public.
The data reveals a classic “Smart Money vs. Retail” standoff, with institutional players digging their heels in for a bearish outcome while retail traders charge forward with unwavering optimism. The key clue? A significant increase in open interest, signaling that this isn’t just a reshuffling of old hands—new, high-conviction money is pouring in on both sides of the trade.
Let’s break down the data to understand the high-stakes tug-of-war that is currently defining the market.
FIIs: The Bearish Conviction Deepens
Foreign Institutional Investors, often referred to as the “smart money” due to their extensive research capabilities and significant capital, have not just maintained their bearish stance; they have actively reinforced it.
The headline number—a net shorting of 52 contracts worth a modest ₹9 crore—barely scratches the surface of the underlying story. To understand their true sentiment, we must look at how they positioned themselves throughout the day:
-
They added 2,072 new short contracts. This is a clear and aggressive bet that the market is poised for a downturn. Institutions do not deploy this level of short-side capital without a strong thesis, likely driven by upcoming global economic data, domestic policy concerns, or internal valuation models signaling over-extension.
-
They also added 1,314 new long contracts. At first glance, this might seem contradictory. Why would bearish players add bullish bets? This nuance is critical. It suggests a multi-layered strategy. These long positions could be hedges against other portfolio assets, or perhaps a minority of institutions are taking a contrarian view. However, the dominant narrative is clear: the new short positions vastly outnumber the new long positions.
This aggressive short-building is starkly reflected in their overall positioning. With a Long:Short ratio of just 19:81, the FII camp is overwhelmingly bearish. This translates to a positional ratio of 0.23, an extremely low figure that indicates for every one contract betting on a rise, FIIs hold more than four contracts betting on a fall. This is not cautious hedging; this is a high-conviction defensive and bearish stance. They are anticipating trouble and positioning their capital accordingly.
Client Behaviour: A Roaring Bullish Counterpoint
In complete opposition to the institutional view, the Client segment demonstrated powerful bullish sentiment. They are not only absorbing the selling pressure from the FIIs but are actively placing their own bets on a market rally.
Let’s dissect their actions:
-
They added a massive 2,344 new long contracts. This is a significant influx of bullish capital. Retail participants are clearly viewing the current market levels as a buying opportunity, undeterred by the institutional selling. This “buy the dip” mentality is a hallmark of a confident retail base.
-
They covered 976 short contracts. This is arguably even more telling. Not only are they buying, but they are also actively closing out their existing bearish bets. This is a “double bullish” signal, indicating a strong belief that the risk of a significant downside move is diminishing.
This unbridled optimism is mirrored in their current positioning. With a Long:Short ratio of 64:36, clients are firmly in the bullish camp. Their positional ratio of 1.76 means that for every 100 contracts they hold, 64 are betting on a market rise. This is a healthy, confident, and aggressively bullish stance that stands in direct, dramatic contrast to the institutional players.
The Decisive Clue: A Surge in Open Interest
Amidst this conflict, the most important piece of data is the net open interest (OI) increase of 2,780 contracts.
Open Interest represents the total number of outstanding futures contracts that have not been settled. When OI increases, it means new money is entering the market and new positions are being created. It signifies rising conviction.
This is not a case where FIIs are simply selling their old longs to clients. Instead, both FIIs and Clients are initiating new positions on opposite sides of the market. This build-up of fresh, committed capital turns the market into a coiled spring. The pressure is mounting, and such a stark divergence in opinion often precedes a period of heightened volatility. A resolution is coming, and when it does, one side will be proven spectacularly wrong.
Trading and Probability: How to Make Profitable Predictions
Last Analysis can be read here
After three days of persistent selling pressure that left traders on edge, the bulls roared back to life in today’s session. But this wasn’t just another relief rally or a technical bounce. Today’s powerful up-move carried a deeper, more profound significance, smashing through a key level of cosmic resistance that could signal a major shift in market dynamics.
The Nifty not only recouped its recent losses but managed to close decisively above 25151, a level that holds immense importance for astro-technical analysts. This wasn’t just any price point; it was the high established during the recent Saturn Retrograde period.
Is this the definitive end of the correction, or simply a trap before the next leg down? The answer lies in the battle between today’s breakout and a crucial astrological event on the horizon.
The Bullish Thesis: Saturn’s Grip is Broken
In financial astrology, Saturn is known as the “Great Taskmaster.” Its retrograde periods are often associated with testing, limitation, reality checks, and the exposure of weak structures. The high point of such a period (25151) often acts as a formidable ceiling—a karmic barrier that represents the peak of the “tested” range.
By decisively closing above this level today, the market has sent a powerful message: the test has been passed. The bulls have not only absorbed the selling pressure but have demonstrated enough strength to break through the structural resistance imposed by Saturn.
This breakout establishes a clear new framework for the market:
-
The Bullish Line in the Sand: The level of 25151 is now the critical support. As long as the bulls can defend this price on a closing basis, the upward momentum is considered intact. A dip towards this level that finds buying support would be seen as a very healthy sign of a successful retest.
-
The Path of Least Resistance is Up: With the Saturnian ceiling now turned into a floor, the bulls have their sights set on higher targets. The next logical zones of resistance are 25359 and, further up, 25491.
The Bearish Counter-Argument: One Day Doesn’t Make a Trend
While the breakout above 25151 is undeniably bullish, the bears are not out of the woods yet. A single day of strength, however significant, can sometimes be a deceptive “bull trap” designed to lure in buyers before a more significant decline.
For the bears to regain control and invalidate today’s bullish signal, they have a clear objective: they must force a close below the psychological and technical support level of 25001. A break below this level would achieve two things:
-
It would completely negate the breakout above the Saturn high.
-
It would signal that the prior three-day downtrend is resuming, likely with increased force as the trapped bulls are forced to liquidate their positions.
The X-Factor: Tomorrow’s Moon Declination
Adding a layer of intense focus to tomorrow’s session is another important astrological event: the Moon Declination. These events are often correlated with a short-term spike in market volatility and can act as catalysts for trend acceleration or reversal. It’s the perfect setup to resolve the tension between the bullish breakout and the bearish hope for a trap.
This anticipated volatility provides a clear, actionable game plan for intraday traders.
The Intraday Strategy for Tomorrow:
Given the high probability of a strong directional move after the open, the opening range breakout strategy becomes particularly potent.
-
Mark the High and Low: For the first 15 minutes of the trading session (e.g., 9:15 AM to 9:30 AM), mark the highest and lowest prices the Nifty hits.
-
Wait for the Breakout: Do not trade within this initial range. Wait for the market to show its hand.
-
Trade with the Momentum:
-
If the Nifty moves decisively above the 15-minute high, it signals that the bulls are in control for the day, and traders can look for long opportunities.
-
If the Nifty breaks below the 15-minute low, it suggests the bears are dominating, and short-side trades can be considered.
-
This strategy allows the initial chaos from the astro event to settle, enabling traders to align themselves with the day’s dominant momentum.
Conclusion
The market is at a fascinating crossroads. The bulls have made a powerful statement by shattering the Saturn Retrograde high at 25151, giving them the clear upper hand. However, the fight is far from over. The key levels are now drawn in the sand: 25151 as primary support for the bulls and 25001 as the breakdown trigger for the bears.
With the Moon Declination promising a dose of volatility tomorrow, the stage is set for a potentially decisive session. All eyes will be on the opening 15-minute range to provide the first, crucial clues as to whether today’s rally was the start of a new ascent or the final, deceptive gasp before a deeper fall.
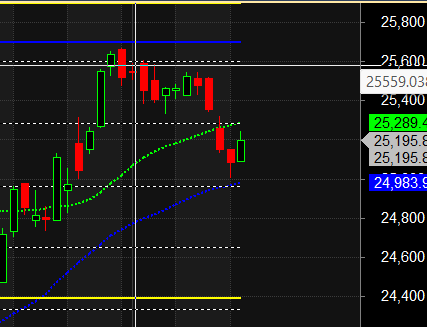
Nifty Trade Plan for Positional Trade ,Bulls will get active above 25239 for a move towards 25318/25397. Bears will get active below 25081 for a move towards 25001/24920
Traders may watch out for potential intraday reversals at 09:59,11:35,12:43,02:07 How to Find and Trade Intraday Reversal Times
Nifty July Futures Open Interest Volume stood at 13.6 lakh cr , witnessing liquidation of 0.38 Lakh contracts. Additionally, the increase in Cost of Carry implies that there was closure of LONG positions today.
Nifty Advance Decline Ratio at 35:15 and Nifty Rollover Cost is @24321 closed above it.
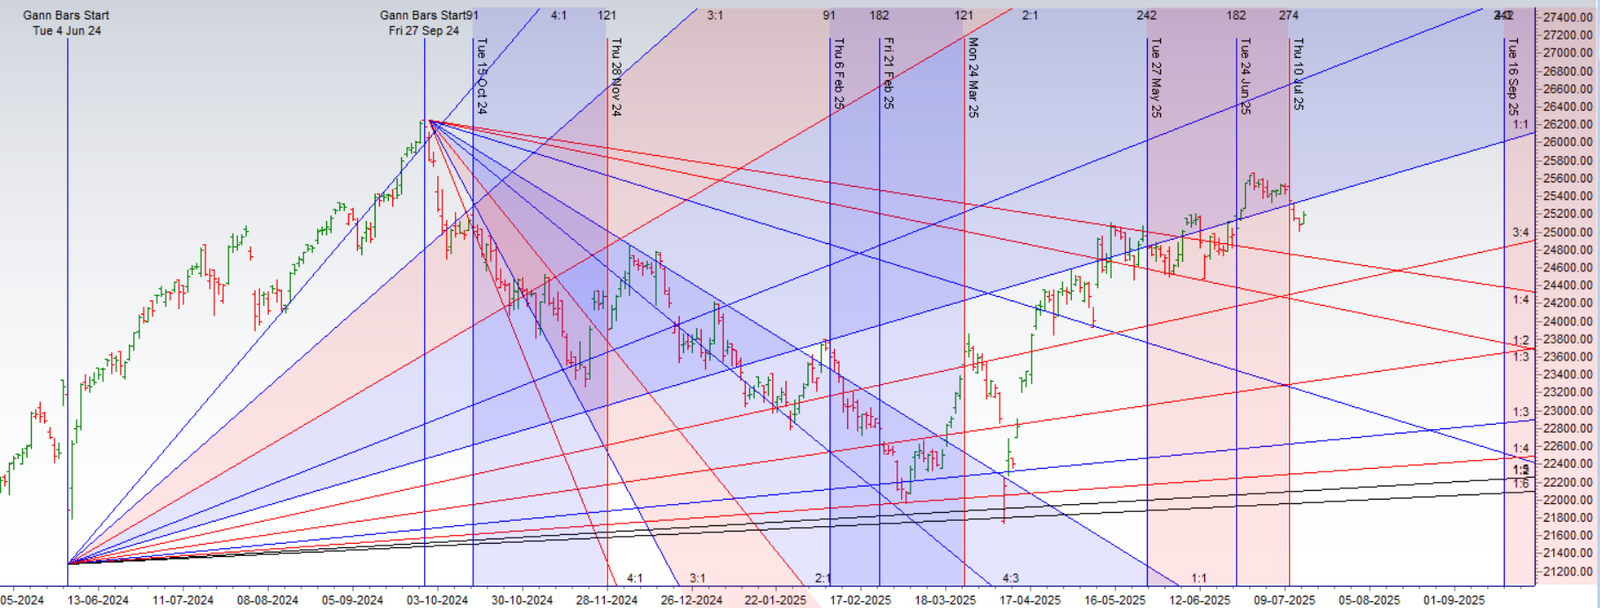
Nifty Gann Monthly Buy Level : 25709
Nifty Gann Monthly Sell Level : 25393
Nifty has closed above its 20 SMA @ 25268 Trend is Sell on Rise till below 25393.
Nifty options chain shows that the maximum pain point is at 25200 and the put-call ratio (PCR) is at 0.75 .Typically, when the PCR open interest ranges between 0.90 and 1.05, the market tends to remain range-bound.
Nifty 50 Options Chain Analysis
The Nifty 50 options chain indicates that the highest open interest (OI) on the call side is at the 25400 strike, followed by 25500 strikes. On the put side, the highest OI is at the 25200 strike, followed by 25100 strikes. This suggests that the market participants are expecting Nifty 50 to remain range between 25200-25500 levels.
The retail segment has become a dominant force in the options market, and their recent activity can only be described as a hurricane of volume. But within this storm, there is no clear direction—only a massive churn of conflicting sentiment.
In the Put Options Arena:
-
Retail traders ADDED a staggering 391,000 put contracts. Buying a put option is a straightforward bearish bet or a hedge against a portfolio decline. This massive number indicates a huge wave of fear or speculation that the market is heading for a fall.
-
Simultaneously, they SHORTED 334,000 put contracts. Shorting a put option is a bullish-to-neutral strategy. It’s a bet that the market will not fall below a certain price by expiration. Traders do this to collect premium, confident that the downside is limited.
This is a market at war with itself. For every four retail traders buying insurance against a crash, three others are confidently selling that insurance. While the net effect is a bearish tilt (57,000 more puts were bought than sold), the sheer volume on both sides points to a state of extreme speculation and widespread disagreement. This is not a market of quiet conviction; it’s a cauldron of high-stakes gambling where retail participants are furiously betting against each other.
In the Call Options Arena:
The data shows retail traders “covered” 52,000 and 25,000 call contracts. Typically, “covering” refers to buying back a short position. If retail traders closed out a total of 77,000 short call positions, it would be a bullish signal, as they are removing their bets against a market rally. However, this bullish signal from calls seems to contradict the net bearish activity in puts, further highlighting the deep-seated confusion within the retail segment.
FIIs’ Call Option Activity:
-
They covered a combined 29,600 (3.3K + 26.3K) call contracts. Just like retail, this means FIIs were buying back their short call positions. But the strategic implication is different. When institutions cover short calls, they are removing the “ceiling” they had placed on the market. They are no longer willing to bet that the market won’t have a sharp move up. This isn’t necessarily a bullish bet; it’s a de-risking move. They are closing out positions that would hurt them in a high-volatility environment.
FIIs’ Put Option Activity:
-
They added a combined 35,900 (18.5K + 17.4K) put contracts. This is the most crucial piece of data on the entire report. Unlike retail, FIIs were not shorting puts to collect premium. Their activity was one-sided: they were aggressively buying put options. Buying puts is the financial equivalent of purchasing insurance. It is a direct, capital-intensive bet to protect a portfolio from a market decline.
Putting the FII Strategy Together:
Let’s look at the FIIs’ two-part maneuver:
-
They are closing their bets that the market has limited upside (covering short calls).
-
They are opening new bets that the market could fall significantly (buying puts).
This is the classic signature of a professional fund preparing for turbulence.
In the cash segment, Foreign Institutional Investors (FII) bought 120 cr , while Domestic Institutional Investors (DII) bought 1555 cr.
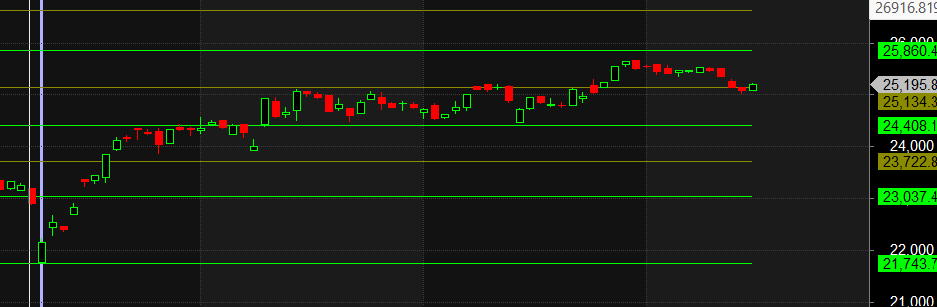
Traders who follow the musical octave trading path may find valuable insights in predicting Nifty’s movements. According to this path, Nifty may follow a path of 23037-23722-24408-25134-25860 This means that traders can take a position and potentially ride the move as Nifty moves through these levels.Of course, it’s important to keep in mind that trading is inherently risky and market movements can be unpredictable.
Don’t trade on emotion. Trading is a numbers game, and it’s important to make decisions based on logic and analysis, not emotion.
For Positional Traders, The Nifty Futures’ Trend Change Level is At 25498 . Going Long Or Short Above Or Below This Level Can Help Them Stay On The Same Side As Institutions, With A Higher Risk-reward Ratio. Intraday Traders Can Keep An Eye On 25242 , Which Acts As An Intraday Trend Change Level.
Nifty Intraday Trading Levels
Buy Above 25223 Tgt 25260, 25289 and 25323 ( Nifty Spot Levels)
Sell Below 25196 Tgt 25166, 25133 and 25100 (Nifty Spot Levels)
Wishing you good health and trading success as always.As always, prioritize your health and trade with caution.
As always, it’s essential to closely monitor market movements and make informed decisions based on a well-thought-out trading plan and risk management strategy. Market conditions can change rapidly, and it’s crucial to be adaptable and cautious in your approach.
► Join Youtube channel : Click here
► Check out Gann Course Details: W.D. Gann Trading Strategies
► Check out Financial Astrology Course Details: Trading Using Financial Astrology
► Check out Gann Astro Indicators Details: Gann Astro Indicators