


Weekly Astro-Trading Forecast: 13–19 July 2025
“Markets vibrate to the pulse of planetary alignments—those who listen trade ahead of the crowd.”
This week’s planetary setup indicates key turning points and volatility spikes across equities and commodities as Mercury, Venus, Saturn, and the Moon interact dynamically. With Mercury’s speed shifts, Saturn’s station, and Bayer rules aligning, traders should prepare for sharp intraday swings and potential trend reversals.
Key Planetary Events & Market Implications
13 July: Saturn Station Retrograde (01° Aries 56′)
-
Saturn’s retrograde in Aries may signal a pause or reassessment in long-term trends for indices. Watch for range-bound markets early in the week.
16 July: Moon Declination
-
Moon at declination often marks short-term volatility spikes, especially in Gold and Crude.
18 July: Mercury Leo S/R & Daily Speed Geocentric Shift
-
Mercury’s shift in speed (Bayer Rule 1) + sign reversal points to a major trend change in Nifty, Bank Nifty & Sensex.
-
Be cautious of false breakouts near this date.
18 July: Venus Sextile Mercury
-
Positive alignment favors support bounces and short-lived rallies in equities and energy markets.
Bayer Rule Highlights
-
15 July (Rule 6): Watch for bottom formations in stocks and commodities.
-
17 July (Rule 1): Mercury’s directional change reinforces a potential trend reversal window.
-
Rule 40 (Venus Helio Latitude): Critical zones for high-probability major moves in Gold & Crude.
Dive Deeper Into Gann & Astro Trading:
W.D. Gann Trading Strategies
Trading Using Financial Astrology
SENSEX Harmonic Pattern
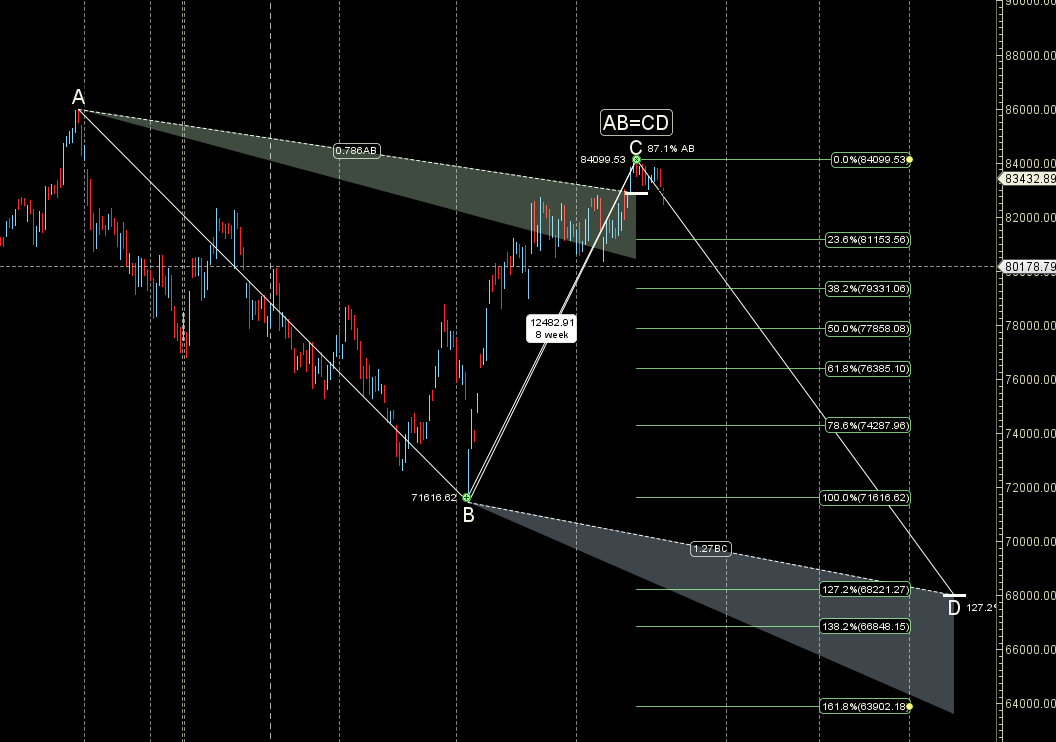
Bulls unable to cross 84100 PRZ zone of ABCD Pattern can lead to fall towards 81769
SENSEX Gann Angles
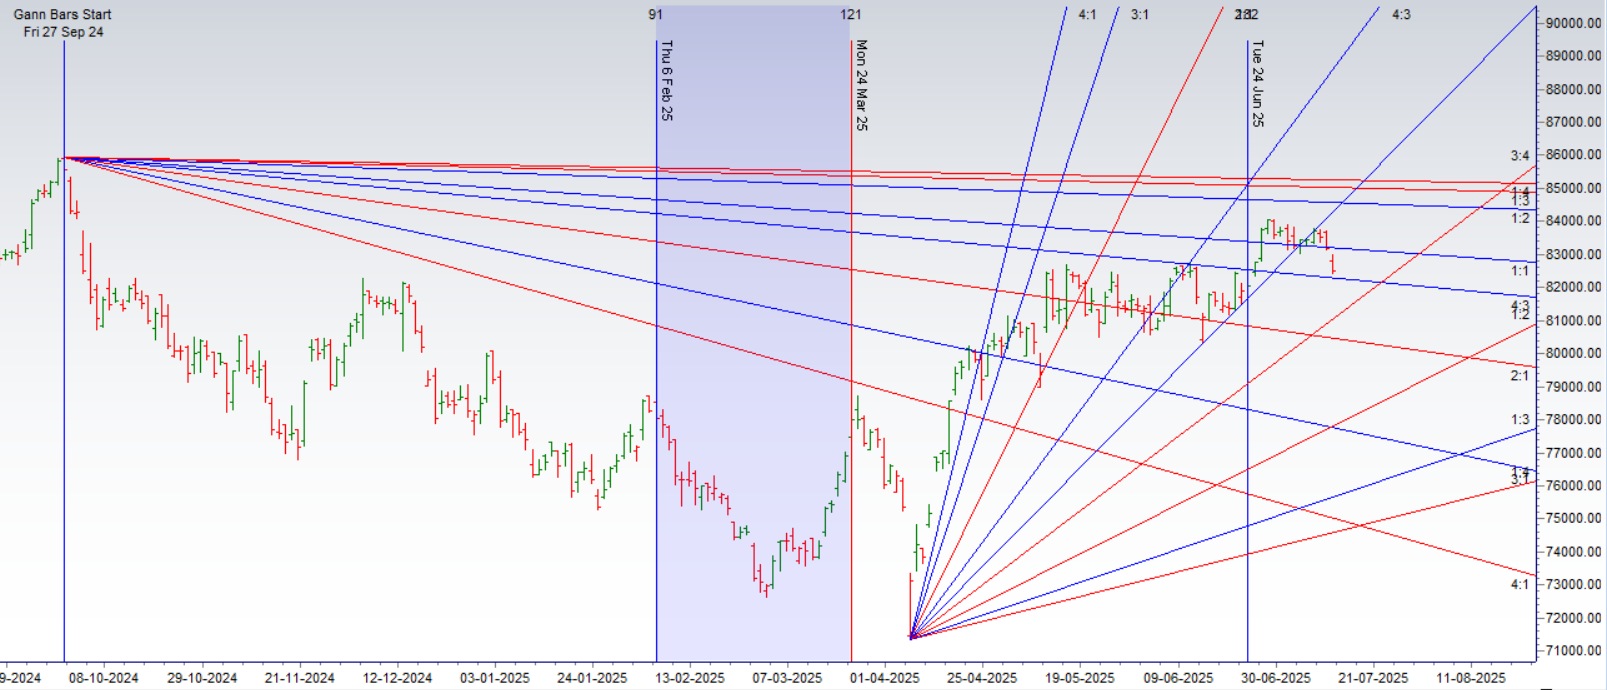
Price has broken its 1×1 gann angle Support zone.
SENSEX Supply and Demand
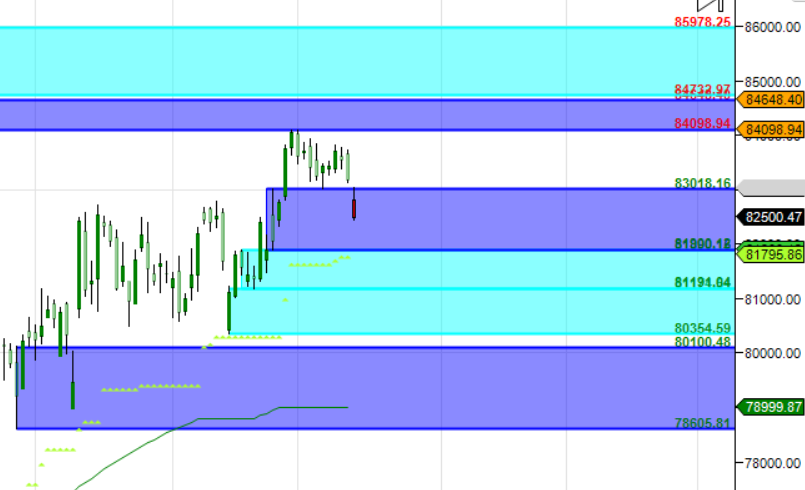
Self Explanatory Chart
SENSEX Time Analysis Pressure Dates
Key Pivot Dates: Watch July 14 th (Saturn Retrograde ) July 18th (Mercury Retrograde) for potential intraday or short-term trend reversals.
SENSEX Weekly Chart
Price has broken Weekly NR21 Pattern on downside
SENSEX Monthly Charts
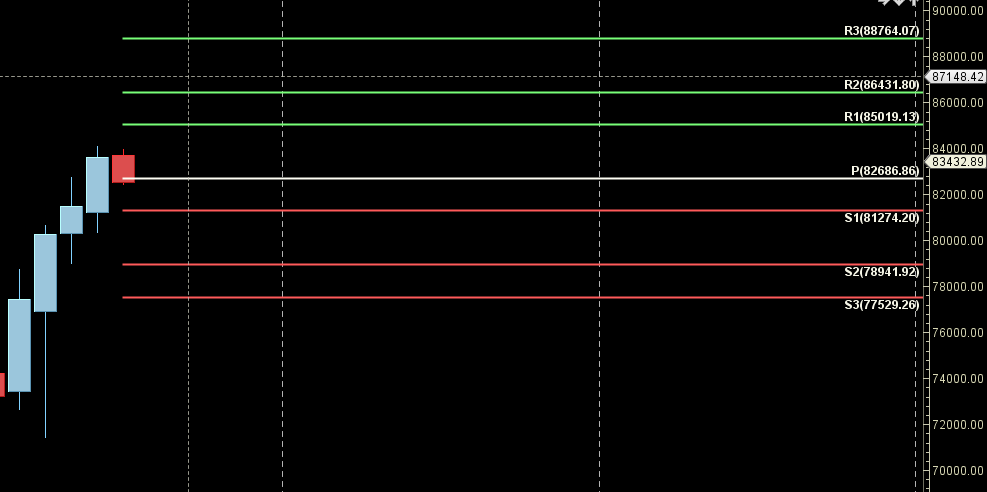
85019 is Monthly resistance zone 82686 is Support zone.
SENSEX Weekly Levels
SENSEX Trend Deciding Level: 82464
SENSEX Resistance: 82752,83040,82319,83509,83799
SENSEX Support:82176,81888,81599,81311,81026
Levels mentioned are SENSEX Spot
Learn More:
W.D. Gann Trading Strategies – Learn how to decode markets using price, time, and geometry.
Trading Using Financial Astrology – Discover how planetary motion impacts market behavior and how to trade it effectively.
Ready to Trade Like a Time-Master?
Join our one-on-one mentorship to master astro-timing, Gann analysis, and institutional-grade setups.
Call: 09985711341
Email: bhandaribrahmesh@gmail.com