


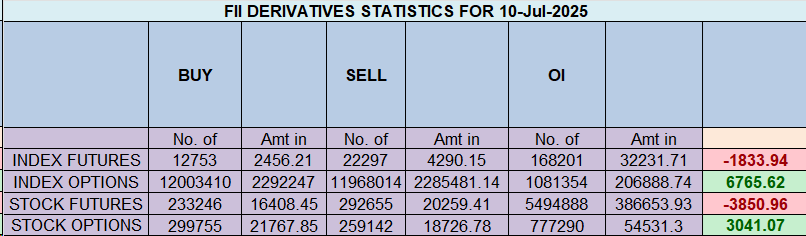
The data reveals a stark divergence in market expectations. Foreign Institutional Investors (FIIs) are deepening their bearish stance on the Nifty, indicating significant caution and anticipation of a potential downside. In complete contrast, Clients (primarily retail investors) are becoming more bullish, absorbing the positions offloaded by FIIs. This creates a classic “Smart Money vs. Retail” standoff, suggesting the market is at a critical inflection point.
1. FIIs are Aggressively Bearish (High Conviction)
-
Covering Longs (5,556 contracts): This isn’t just a lack of new buying; it’s an active decision to exit existing bullish positions. It signals a belief that the upside potential is limited or that the risk of a downturn has increased.
-
Adding Shorts (3,988 contracts): FIIs are simultaneously placing new bets that the market will fall.
-
The Action: The combination of exiting longs and adding shorts is a powerful bearish signal. It’s a “double whammy” that shows high conviction in their negative outlook.
-
The Ratio (0.32): A Long:Short ratio of 25:75 is extremely low. It indicates that for every one long contract, FIIs hold three short contracts. This is a heavily skewed, defensive, and bearish positioning.
2. Clients are Confidently Bullish
-
Adding Longs (4,876 contracts): Retail participants are actively buying into the market, likely viewing current levels as an opportunity.
-
Covering Shorts (3,518 contracts): They are also closing out their bearish bets, suggesting they believe the risk of a further fall is diminishing.
-
The Ratio (1.46): A Long:Short ratio of 59:41 is a healthy bullish signal, showing clear optimism among this cohort.
The Big Picture: The Market Tug-of-War
This data paints a picture of a major disagreement in the market:
-
Who is Selling to Whom? The FIIs are selling, and the Clients are buying.
-
Net OI Decrease (-1,321 contracts): This is a crucial piece of information. Despite the flurry of activity, the total number of open positions decreased. This suggests that the number of contracts being closed (FIIs exiting longs) was greater than the number of new contracts being initiated. It points towards an overall de-risking environment, even as sentiment diverges.
-
Implication: Such a stark divergence is often a precursor to increased volatility. The market is tightly coiled. A resolution will occur when one side is proven wrong and is forced to unwind its positions, which would accelerate the market’s move in the opposite direction.
-
If the market moves up: FIIs would be forced to cover their massive short positions, leading to a “short-covering rally.”
-
If the market moves down: Clients would be forced to liquidate their long positions, potentially leading to a sharp sell-off.
-
Conclusion
The FII activity on 10th July 2025 is a strong red flag. The “smart money” is not just cautious; they are actively betting on a decline. The “caution ahead of key global and domestic triggers” is their reason for building this defensive wall.
While the retail segment remains optimistic, the institutional bearishness, reflected in the heavily skewed Long:Short ratio, should not be ignored. The market is now waiting for a catalyst to determine which side will win this high-stakes tug-of-war.
Trading and Probability: How to Make Profitable Predictions
Last Analysis can be read here
-
Market View: Decidedly Bearish for the day.
-
Primary Catalyst: Gann Time Cycle alignment suggesting a turn or acceleration down.
-
Initial Scenario: Expecting a gap-down opening.
-
Key Support Level 1 (Pre-Open): ~25243 (Gann Angle Support). A break of this level is the first bearish sign.
-
Confirmation Trigger: A break below the low of the first 15-minute candle after the gap down. This is a classic price action signal for confirming intraday trend continuation.
-
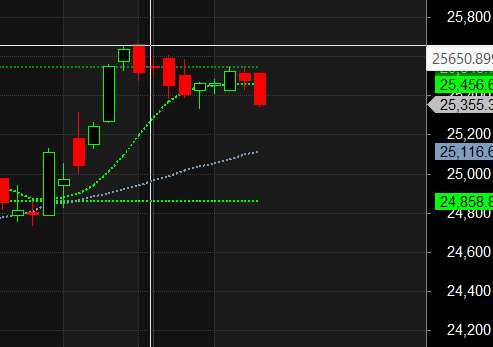
Primary Downside Target: 25116.
-
Crucial Weekly Level: 25222. Bulls must hold this level by the end of the day for the weekly close to avoid further structural damage.
-
Overarching Influences:
-
Sector-Specific Weakness: IT sector downtrend, which you attribute to the Uranus cycle, adding to the bearish pressure.
-
Volatility Event: Full Moon, often correlated with increased volatility and potential trend reversals or culminations.
-
-
Risk Management: Due to the weekend “Saturn Retrograde” event risk, any overnight positions should be hedged.
The confluence of Gann time cycles and the Full Moon points to a high probability of a down move today. This is supported by weakness in the IT sector.
The trade becomes active only if the market gaps down and then breaks the initial 15-minute low. If the market fails to break that low and instead reclaims the Gann angle support at 25331, the bearish thesis for the day would be invalidated or at least challenged. The ultimate test for the week will be the bulls’ ability to defend 25222 into the close.

Nifty Trade Plan for Positional Trade ,Bulls will get active above 25284 for a move towards 25364/25444. Bears will get active below 25204 for a move towards 25124/25044
Traders may watch out for potential intraday reversals at 09:41,11:30,12:41,01:25,02:20 How to Find and Trade Intraday Reversal Times
Nifty July Futures Open Interest Volume stood at 13.4 lakh cr , witnessing addition of 0.09 Lakh contracts. Additionally, the increase in Cost of Carry implies that there was closure of LONG positions today.
Nifty Advance Decline Ratio at 26:24 and Nifty Rollover Cost is @24321 closed above it.
Nifty Gann Monthly Buy Level : 25709
Nifty Gann Monthly Buy Level : 25393
Nifty has closed above its 20 SMA @ 25226 Trend is Sell on Rise till below 25500.
Nifty options chain shows that the maximum pain point is at 25400 and the put-call ratio (PCR) is at 0.62 .Typically, when the PCR open interest ranges between 0.90 and 1.05, the market tends to remain range-bound.
Nifty 50 Options Chain Analysis
The Nifty 50 options chain indicates that the highest open interest (OI) on the call side is at the 25500 strike, followed by 25600 strikes. On the put side, the highest OI is at the 25200 strike, followed by 25100 strikes. This suggests that the market participants are expecting Nifty 50 to remain range between 25200-25500 levels.
In the cash segment, Foreign Institutional Investors (FII) bought 585 cr , while Domestic Institutional Investors (DII) bought 20 cr.
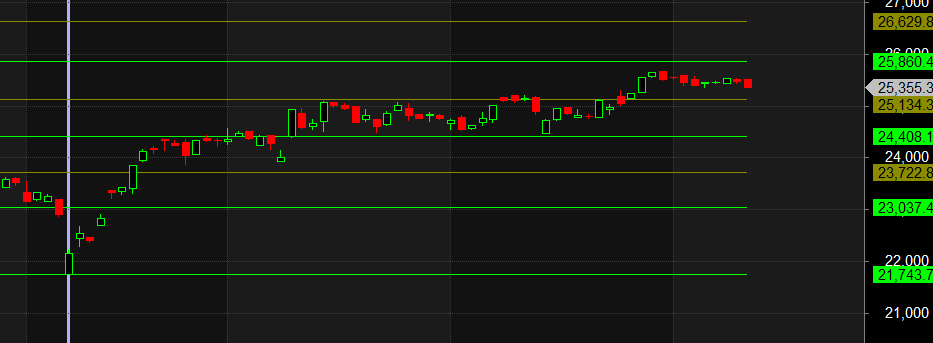
Traders who follow the musical octave trading path may find valuable insights in predicting Nifty’s movements. According to this path, Nifty may follow a path of 23037-23722-24408-25134-25860 This means that traders can take a position and potentially ride the move as Nifty moves through these levels.Of course, it’s important to keep in mind that trading is inherently risky and market movements can be unpredictable.
Don’t trade on emotion. Trading is a numbers game, and it’s important to make decisions based on logic and analysis, not emotion.
For Positional Traders, The Nifty Futures’ Trend Change Level is At 25575. Going Long Or Short Above Or Below This Level Can Help Them Stay On The Same Side As Institutions, With A Higher Risk-reward Ratio. Intraday Traders Can Keep An Eye On 25463 , Which Acts As An Intraday Trend Change Level.
Nifty Intraday Trading Levels
Buy Above 25223 Tgt 25260, 25289 and 25323 ( Nifty Spot Levels)
Sell Below 25200 Tgt 25166, 25133 and 25100 (Nifty Spot Levels)
Wishing you good health and trading success as always.As always, prioritize your health and trade with caution.
As always, it’s essential to closely monitor market movements and make informed decisions based on a well-thought-out trading plan and risk management strategy. Market conditions can change rapidly, and it’s crucial to be adaptable and cautious in your approach.
► Join Youtube channel : Click here
► Check out Gann Course Details: W.D. Gann Trading Strategies
► Check out Financial Astrology Course Details: Trading Using Financial Astrology
► Check out Gann Astro Indicators Details: Gann Astro Indicators