


Nifty Index Futures Analysis (18 June): FIIs Maintain Bearish Stance, Clients Hold Long Positions
Market Summary: FII Activity in Nifty Index Futures
On the 18th of June, Foreign Institutional Investors (FIIs) reinforced their bearish instance on the Nifty Index Futures market. Their activity for the day included:
-
Net Shorting: FIIs created new short positions, selling 1,346 contracts.
-
Value of Shorting: The total value of these shorted contracts was ₹252 crore.
-
Open Interest Impact: This activity contributed to a net open interest decrease of 540 contracts, suggesting that more positions were closed than initiated across the market.
Breaking Down FII Data for 18 June
A closer look at the FII activity reveals significant position adjustments on both sides:
-
Long Unwinding: FIIs covered (closed) 1,365 long contracts, reducing their bullish exposure.
-
Short Covering: Simultaneously, they covered 1,715 short contracts, indicating some profit-booking on previous bearish bets.
How Retail Clients Positioned Themselves
In contrast to the institutional sentiment, the client segment (often representing retail traders) also saw significant position closing.
-
Longs Covered: Clients closed out a substantial 2,788 long contracts.
-
Shorts Covered: They also closed 1,362 short contracts.
Current Positioning: FIIs vs. Clients Long-Short Ratio
The current overall positioning in Nifty Index Futures highlights a clear divergence between FIIs and retail clients.
FII Current Stand (Strongly Bearish)
-
Long-Short Ratio: 20:80
-
Ratio Value: 0.25
-
Interpretation: This heavily skewed ratio indicates a strong bearish conviction among FIIs, with their short positions vastly outnumbering their long positions.
Client Current Stand (Net Bullish)
-
Long-Short Ratio: 61:39
-
Ratio Value: 1.55
-
Interpretation: Clients maintain a bullish-to-neutral stance. With a ratio well above 1, they are holding significantly more long positions than short positions, anticipating an upward market movement.
Why Trading Education Is Crucial For Success & Profit
Key Market Driver: An Exciting Nifty Weekly Expiry Ahead
Traders are anticipating an eventful Nifty weekly expiry today, with market movements potentially influenced by significant astrological alignments. This unique perspective suggests a day of heightened volatility and potential trend shifts.
Today’s Key Astrological Aspects:
-
Moon Declination: In financial astrology, periods of Moon Declination are often associated with market turning points or emotional, unpredictable price action.
-
Jupiter Square Neptune: This is considered a major astrological aspect. It can correlate with periods of uncertainty, idealism, or delusion in the markets, potentially leading to sharp and unexpected swings as sentiment shifts.
As highlighted in detailed astro-financial forecasts, the convergence of these two celestial events on an expiry day makes it a critical session to watch. Traders should be prepared for increased volatility and approach the market with a well-defined strategy.
Nifty Trade Plan for Positional Trade ,Bulls will get active above 24904 for a move towards 25063/25222. Bears will get active below 24746 for a move towards 24587/24428
Traders may watch out for potential intraday reversals at 09:31,10:38,1:02,02:24 How to Find and Trade Intraday Reversal Times
Nifty May Futures Open Interest Volume stood at 1.11 lakh cr , witnessing liquidation of 3.9 Lakh contracts. Additionally, the increase in Cost of Carry implies that there was adding of SHORT positions today.
Nifty Advance Decline Ratio at 30:20 and Nifty Rollover Cost is @24321 closed above it.
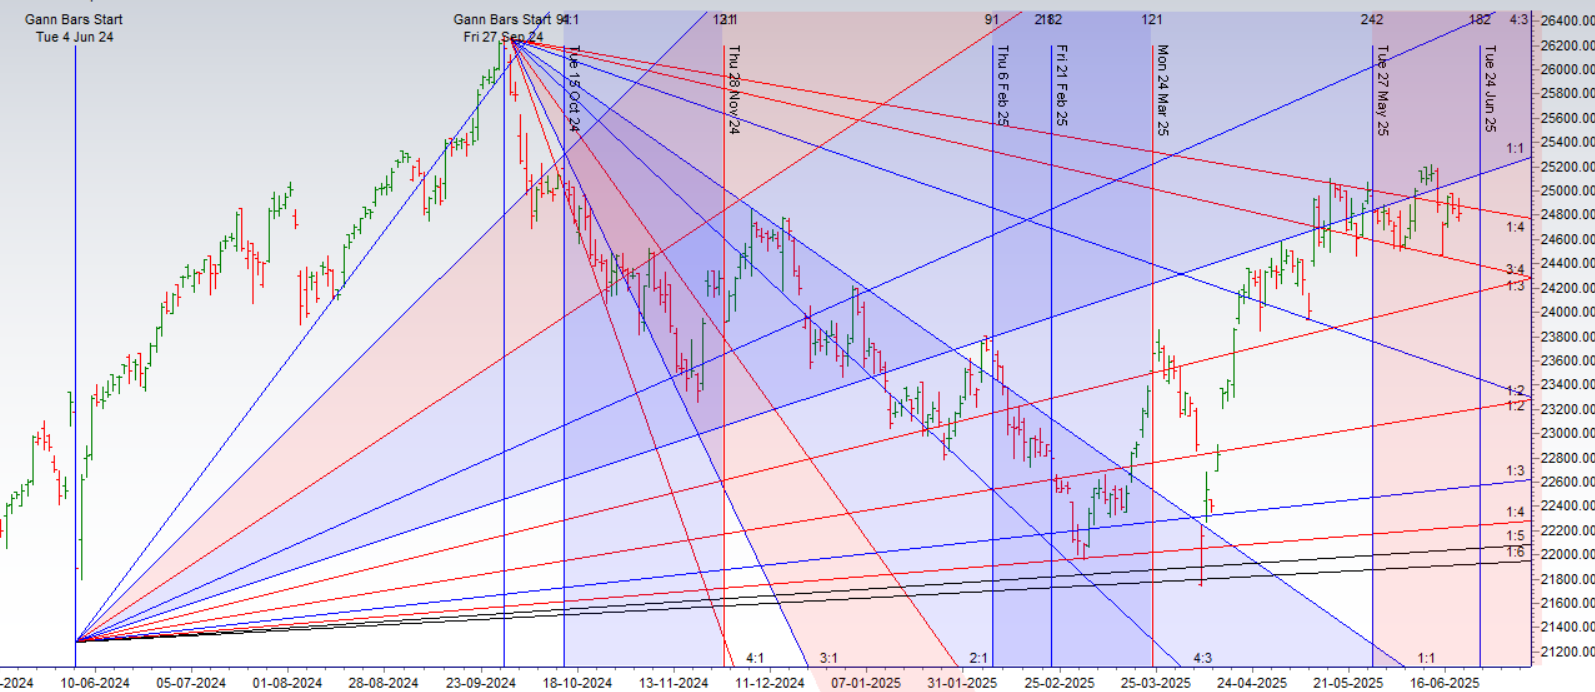
Nifty Gann Monthly Buy Level : 24822 — Closed above it
Nifty Gann Monthly Buy Level : 24669
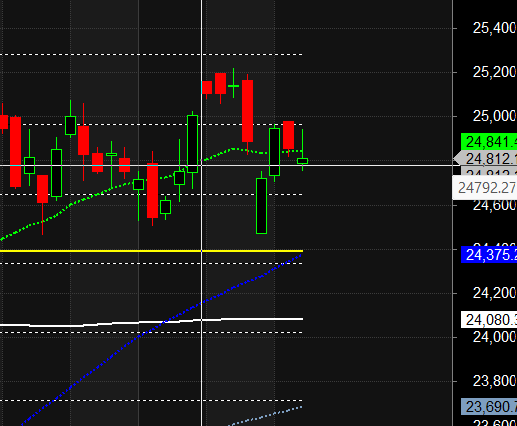
Nifty has closed below its 20 SMA @ 24841 Trend is Buy on Dips till above 24800.
Nifty options chain shows that the maximum pain point is at 24800 and the put-call ratio (PCR) is at 0.62.Typically, when the PCR open interest ranges between 0.90 and 1.05, the market tends to remain range-bound.
Nifty 50 Options Chain Analysis
The Nifty 50 options chain indicates that the highest open interest (OI) on the call side is at the 24900 strike, followed by 25000 strikes. On the put side, the highest OI is at the 24700 strike, followed by 24600 strikes. This suggests that the market participants are expecting Nifty 50 to remain range between 24600-24900 levels.
Options Market Analysis: Retail Activity vs. FII Strategy
Retail Trader Activity: High Volume with Mixed Sentiment
Retail investors were highly active in the options market, executing a large number of trades on both call and put options. Their positioning suggests a mixed but slightly bullish bias.
Call Option Data (Retail):
-
Long Positions Added: 384,000 contracts
-
Short Positions Added: 356,000 contracts
-
Analysis: Retail traders were net buyers of call options, indicating a belief that the market or specific stocks could move higher. However, the significant number of shorted calls shows that many are also betting against a strong upward rally.
Put Option Data (Retail):
-
Long Positions Added: 33,000 contracts
-
Short Positions Added: 26,000 contracts
-
Analysis: Retail was a net buyer of put options, which is a bearish strategy used to hedge against or profit from a market decline.
FII Activity: A Clear Bearish Stance Emerges
Foreign Institutional Investors (FIIs) demonstrated a clear and strategic approach, positioning themselves for limited upside or a potential downturn in the market.
Call Option Data (FII):
-
Long Positions Added: 15,800 contracts
-
Short Positions Added: 62,000 contracts
-
Analysis: FIIs engaged in aggressive call writing (shorting). By shorting over 4x more calls than they bought, they are signaling a strong conviction that the market’s upside potential is capped.
Put Option Data (FII):
-
Positions Covered: 982 contracts
-
Short Positions Added: 28,500 contracts
-
Analysis: FIIs were significant sellers of put options (shorting puts). This is typically a neutral-to-bullish strategy where investors collect premium, betting that the market will not fall below a certain level. When combined with their heavy call shorting, it suggests FIIs may be expecting the market to trade within a defined range.
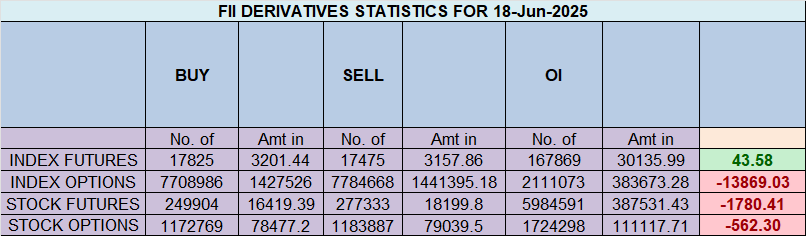
In the cash segment, Foreign Institutional Investors (FII) bought 890 cr , while Domestic Institutional Investors (DII) bought 1091 cr.
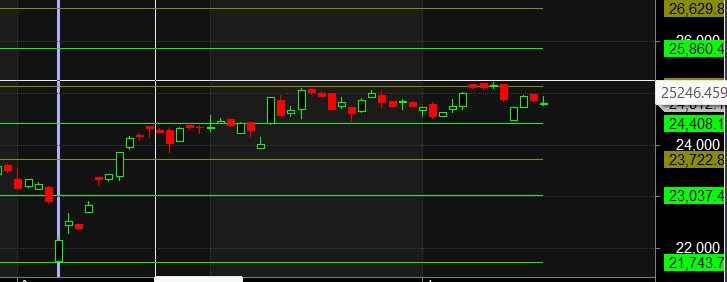
Traders who follow the musical octave trading path may find valuable insights in predicting Nifty’s movements. According to this path, Nifty may follow a path of 23037-23722-24408-25134-25860 This means that traders can take a position and potentially ride the move as Nifty moves through these levels.Of course, it’s important to keep in mind that trading is inherently risky and market movements can be unpredictable.
Be patient. The market is constantly changing, and it’s important to be patient when trading. Don’t expect to make a lot of money overnight. Be patient and let the market work in your favor.
For Positional Traders, The Nifty Futures’ Trend Change Level is At 24926 . Going Long Or Short Above Or Below This Level Can Help Them Stay On The Same Side As Institutions, With A Higher Risk-reward Ratio. Intraday Traders Can Keep An Eye On 24866 , Which Acts As An Intraday Trend Change Level.
Nifty Expiry Range
Upper End of Expiry : 24975
Lower End of Expiry : 24605
Nifty Intraday Trading Levels
Buy Above 24824 Tgt 24864, 24910 and 24975 ( Nifty Spot Levels)
Sell Below 24777 Tgt 24729, 24700 and 24666 (Nifty Spot Levels)
Wishing you good health and trading success as always.As always, prioritize your health and trade with caution.
As always, it’s essential to closely monitor market movements and make informed decisions based on a well-thought-out trading plan and risk management strategy. Market conditions can change rapidly, and it’s crucial to be adaptable and cautious in your approach.
► Join Youtube channel : Click here
► Check out Gann Course Details: W.D. Gann Trading Strategies
► Check out Financial Astrology Course Details: Trading Using Financial Astrology
► Check out Gann Astro Indicators Details: Gann Astro Indicators