


Key Astro Dates and Their Market Impact: Week Ahead
1. Saturn in Aries (Ongoing)
Saturn, the planet of structure and discipline, is in fiery Aries.
Expect tension between control and aggression — markets may hesitate before breakout.
Watch for sharp declines followed by recoveries especially in PSU banks and midcaps.
2. Mercury in Gemini (Ongoing)
Mercury rules communication and trading; Gemini adds duality.
Ideal for whipsaw price action, especially in Nifty and Sensex.
Traders must avoid emotional entries and stick to system-based plans.
3. New Moon –
New Moon = energy reset and cycle change.
Often brings trend reversals, especially 1 day before or after.
Watch for gap openings and failed follow-throughs — fakeouts are common.
☀️ 4. Sun Conjunct Mercury –
Known for news-driven spikes, misdirection, and market overreactions.
Avoid trading the first breakout candle — observe reaction to news instead.
This conjunction often leads to false optimism or panic in financial and IT stocks.
5. Venus Semi-Square Mercury –
Subtle but impactful — brings emotional confusion in the market.
Often causes divergence between FII buying vs actual price action.
Not ideal for large intraday positions — scalp instead.
6. Bayer Rule 27 (Mercury Speed Between 59′ – 1°58′)
High-probability tops or bottoms around this period.
Check Mercury’s daily geocentric speed; if in this range, prepare for swing reversals.
Combine with New Moon energy = explosive intraday turns possible.
⚠️ Astro Tip:
If 3 or more astro events fall within 2 trading sessions, expect volatility spikes. This week qualifies — be cautious around
Dive Deeper Into Gann & Astro Trading:
W.D. Gann Trading Strategies
Trading Using Financial Astrology
SENSEX Harmonic Pattern
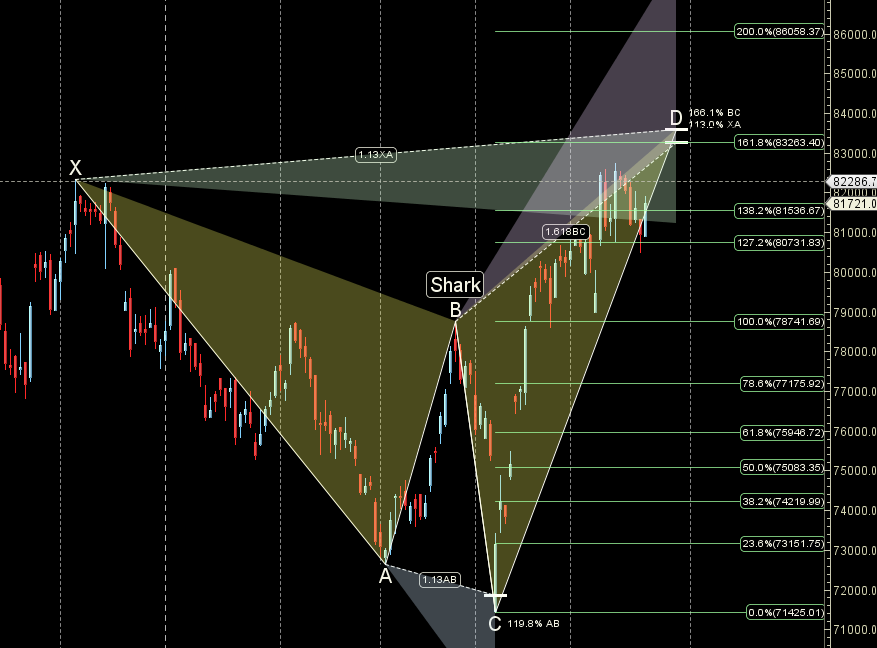
Shark Pattern PRZ zone around 83000-83263.
SENSEX Gann Angles
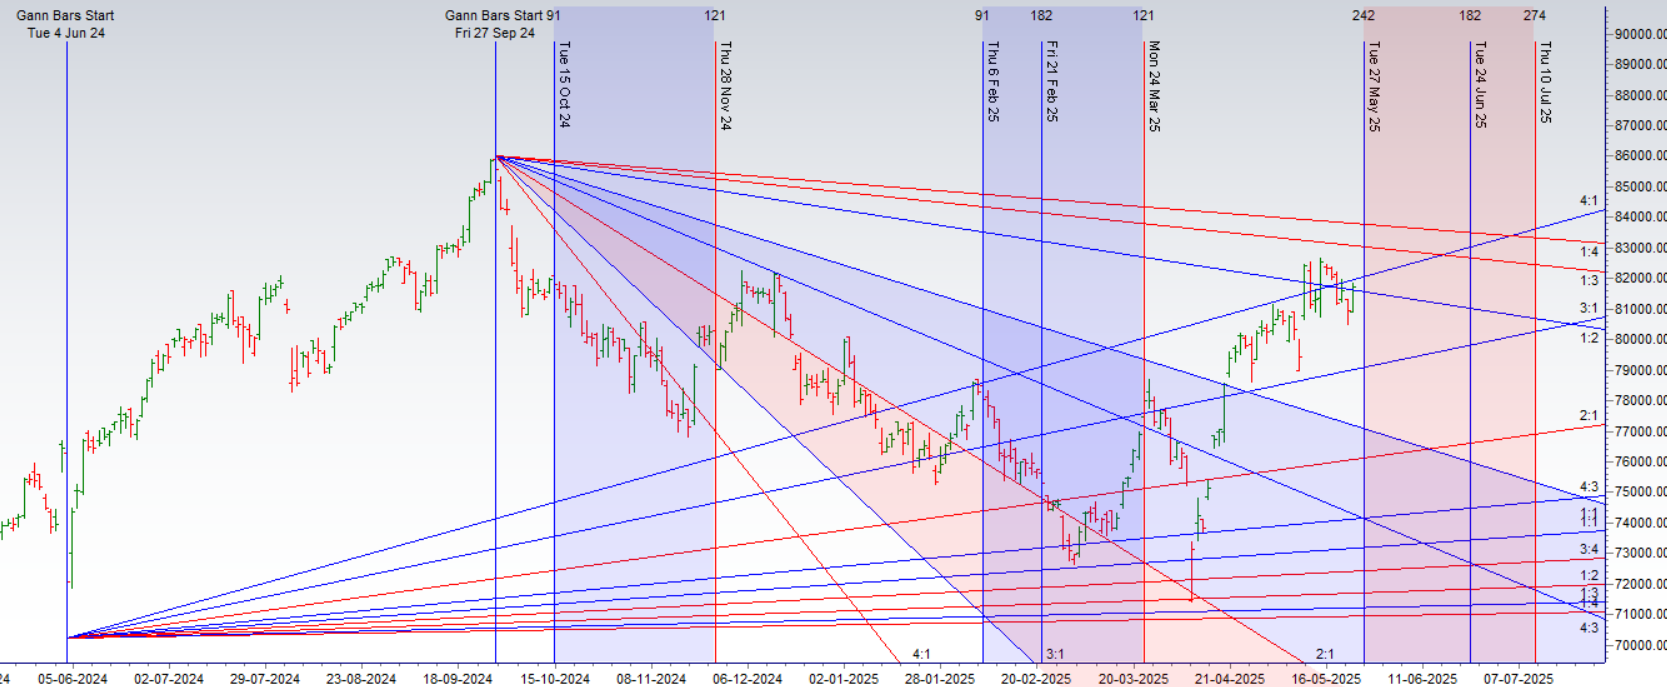
Price is near its 1×3 gann angle resistance zone.
SENSEX Supply and Demand
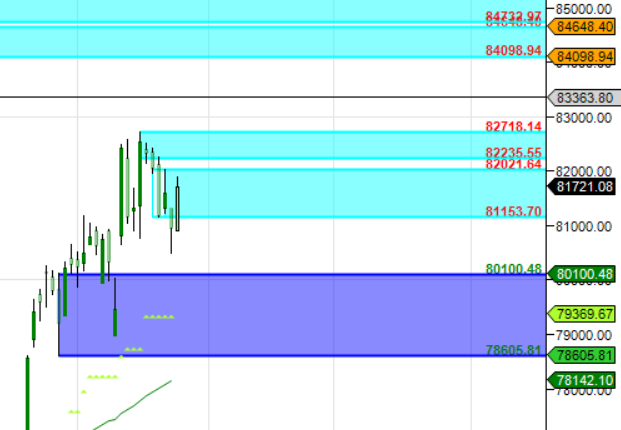
Self Explanatory Chart
SENSEX Time Analysis Pressure Dates
26 May is the Important Gann/Astro Date for coming week.
SENSEX Weekly Chart
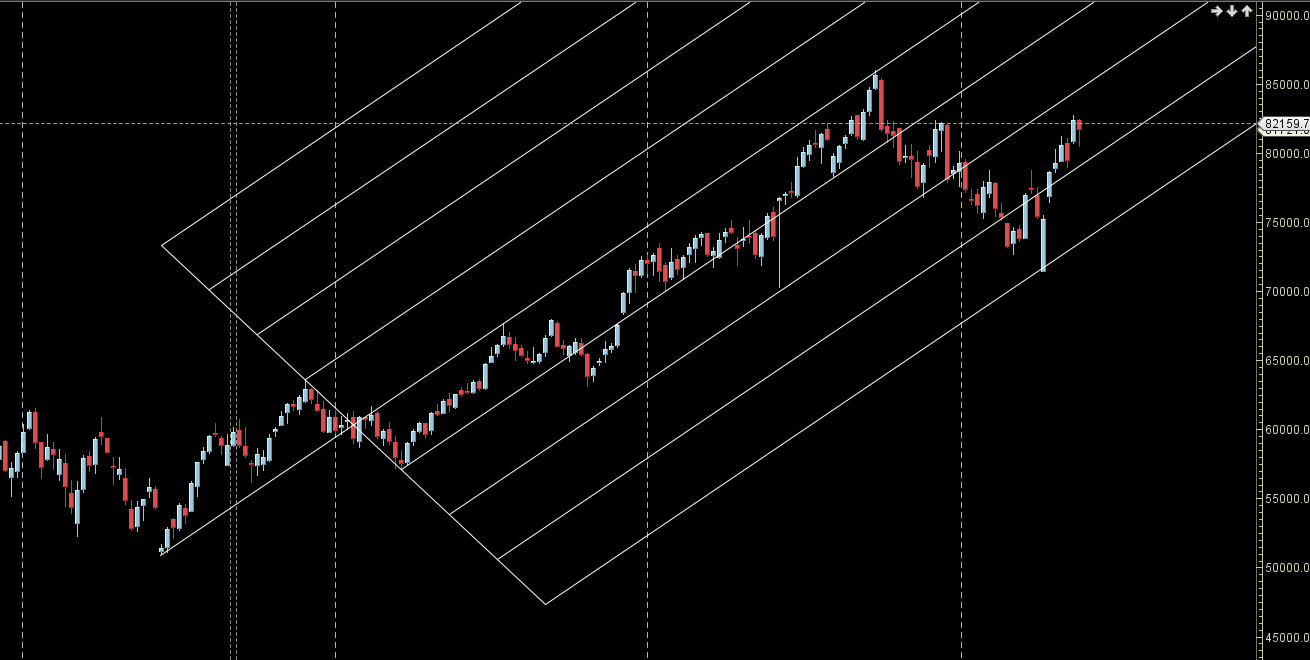
Price has closed above Weekly above AF resistance zone.
SENSEX Monthly Charts
83460 is Monthly resistance zone 81000 is Support zone.
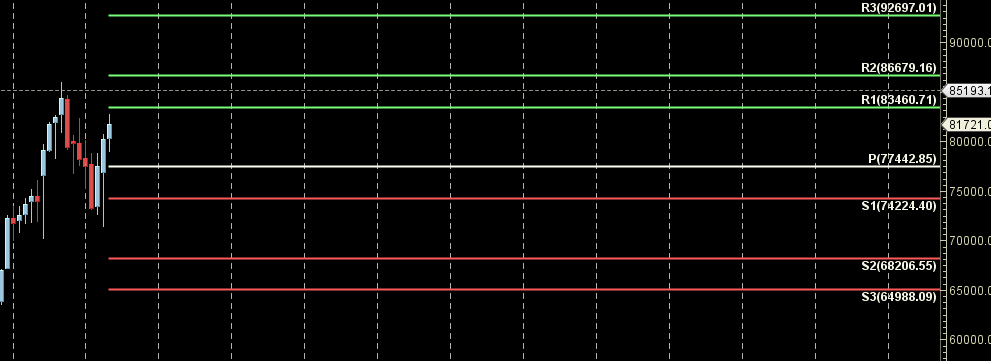
SENSEX Weekly Levels
SENSEX Trend Deciding Level: 81624
SENSEX Resistance: 81908,82192,82475,82759,83008
SENSEX Support:81341,81057,80777,80489,80108
Levels mentioned are SENSEX Spot
Learn More:
W.D. Gann Trading Strategies – Learn how to decode markets using price, time, and geometry.
Trading Using Financial Astrology – Discover how planetary motion impacts market behavior and how to trade it effectively.
Ready to Trade Like a Time-Master?
Join our one-on-one mentorship to master astro-timing, Gann analysis, and institutional-grade setups.
Call: 09985711341
Email: bhandaribrahmesh@gmail.com