


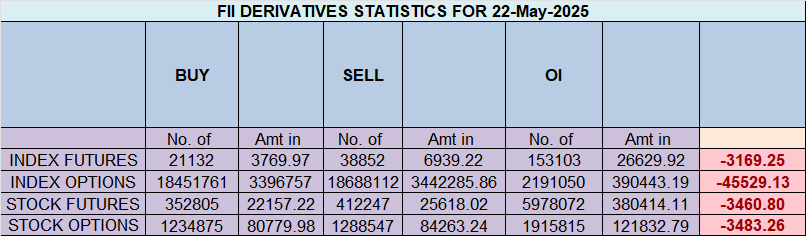
⚖️ FIIs Maintain Neutral Stance in Nifty Futures – May 22, 2024
Foreign Institutional Investors (FIIs) showed a bearish bias in the Nifty Index Futures market, Shorting 12541 contracts worth ₹2317 crore. However, the session saw a net open interest (OI) increase of 1829 contracts, indicating continued position lightening rather than aggressive buildup.
FII Activity Breakdown:
-
✔ Longs Covered: 7066 contracts
-
✔ Shorts Added: 10654 contracts
-
Net OI Change: 1829 contracts
-
FII Long-to-Short Ratio: 0.46
-
Current FII Positioning: 37% Long : 63% Short
Interpretation:
FIIs are gradually neutralizing their bearish exposure, but still remain net short. The OI drop implies a wait-and-watch approach, possibly due to upcoming event risks or consolidation at higher levels.
Client Behavior:
-
✔ Longs Added: 10157 contracts
-
✔ Shorts Covered: 11113 contracts
-
Client Long-to-Short Ratio: 1.56
-
Current Client Positioning: 57% Long : 43% Short
Interpretation:
Clients continue to build bullish exposure, suggesting that retail and proprietary desks expect further upside, or at least are betting on sustained strength above key supports like 24,500.
How to Erase a Losing Streak in 24 Hours with the Brain Reset Protocol
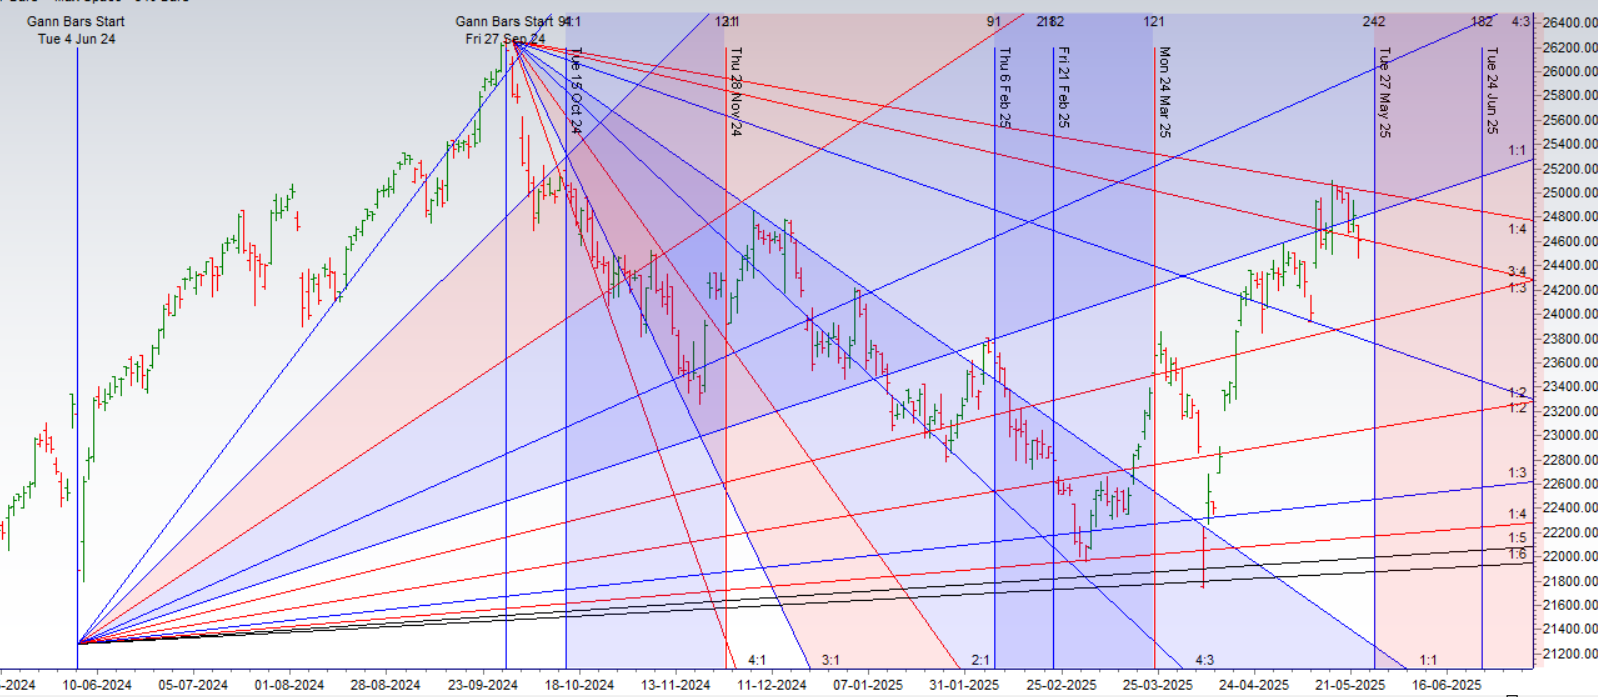
Nifty has formed a classic Inside Bar pattern, signaling indecision and consolidation—but also laying the groundwork for a potential breakout. What makes this setup significant is the confluence of both Gann and astrological time cycles, indicating that the market is at a critical inflection point.
️ Today also marks the weekly expiry, which often acts as a volatility trigger when combined with technical and time-based patterns.
⚠️ What to Watch For:
-
Breakout Levels:
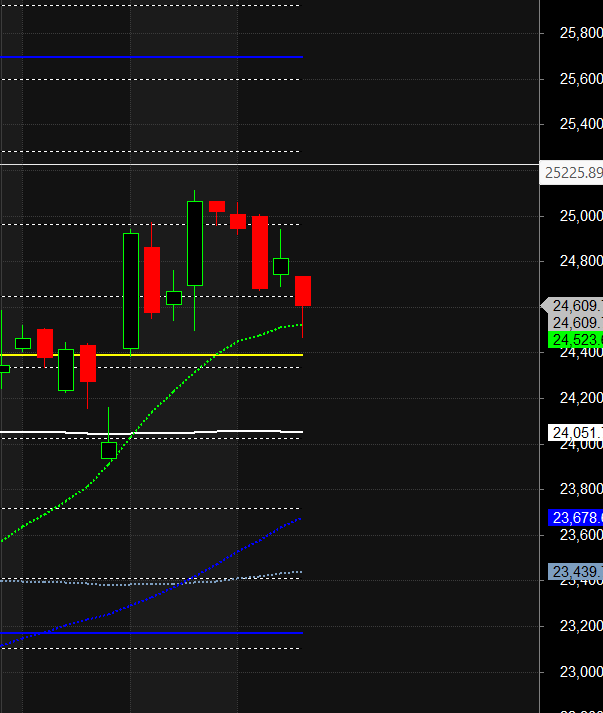
Upside Trigger: Above 24950
Breakdown Trigger: Below 24650
A break on either side could lead to a sharp directional move in the next 1–2 sessions. -
Time Cycle Relevance:
The ongoing astro-Gann alignment strengthens the case for a trending move. These cycles are known to initiate strong price reactions especially when technical compression (like an Inside Bar) is in play.
Bayer Rule 6:
“The price is at a bottom when Mars is at 16°35′ of any zodiac sign, and a reversal is likely as it moves +30°.”
This astrological condition is coming into effect today, signaling a potential key turning point for Nifty. Historically, this setup has preceded sharp trend changes, especially when prices are coiling in narrow ranges — just like we’re seeing now.
Technical + Astro Confluence
-
Current Setup: Nifty is trading in a tight range, reflecting compression — typically a precursor to volatility expansion.
-
Time Trigger: The astro cycle activation combined with weekly closing pressure can act as a catalyst for a breakout or breakdown in the next 1–2 sessions.
Key Weekly Closing Levels to Watch:
-
Bullish Control Zone: 24900–24950
A close here may reinforce the uptrend and encourage continuation next week. -
Bearish Control Zone: Below 24650
A close below this level could invite selling pressure and profit booking.
Trading Strategy:
-
Stay light ahead of the close; volatility expansion is expected early next week.
-
Watch for a breakout from today’s range.
-
Use weekly close positioning to gauge directional bias for Monday.
Nifty Trade Plan for Positional Trade ,Bulls will get active above 24950 for a move towards 25076/25207 Bears will get active below 24650 for a move towards 24554/24424
Traders may watch out for potential intraday reversals at 09:35,11:20,12:16,02:44 How to Find and Trade Intraday Reversal Times
Nifty May Futures Open Interest Volume stood at 1.07 lakh cr , witnessing liquidation of 3.9 Lakh contracts. Additionally, the increase in Cost of Carry implies that there was closeure of LONG positions today.
Nifty Advance Decline Ratio at 19:31 and Nifty Rollover Cost is @24321 closed above it.
Nifty Gann Monthly Trade level :24211 closed above it
Nifty has closed Above its 200 SMA @ 24509 Trend is Buy on Dips till above 24525
Nifty options chain shows that the maximum pain point is at 24800 and the put-call ratio (PCR) is at 0.64.Typically, when the PCR open interest ranges between 0.90 and 1.05, the market tends to remain range-bound.
Nifty 50 Options Chain Analysis
The Nifty 50 options chain indicates that the highest open interest (OI) on the call side is at the 24800 strike, followed by 25000 strikes. On the put side, the highest OI is at the 24400 strike, followed by 24300 strikes. This suggests that the market participants are expecting Nifty 50 to remain range between 24500-24900 levels.
In the cash segment, Foreign Institutional Investors (FII) sold 5045 Cr , while Domestic Institutional Investors (DII) bought 3715 cr.
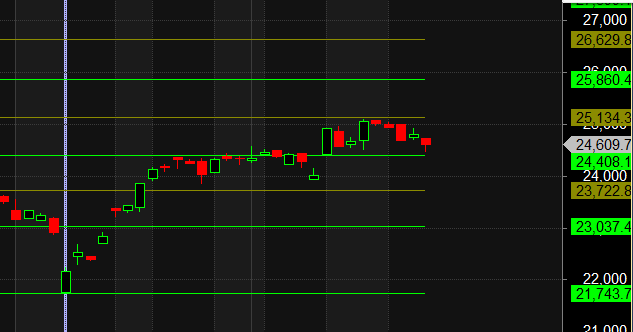
Traders who follow the musical octave trading path may find valuable insights in predicting Nifty’s movements. According to this path, Nifty may follow a path of 23037-23722-24408-25134 This means that traders can take a position and potentially ride the move as Nifty moves through these levels.Of course, it’s important to keep in mind that trading is inherently risky and market movements can be unpredictable.
Those who succeed big at anything all have the same attitude: You keep going until it happens or you die trying. Quitting is not an option.
For Positional Traders, The Nifty Futures’ Trend Change Level is At 24595. Going Long Or Short Above Or Below This Level Can Help Them Stay On The Same Side As Institutions, With A Higher Risk-reward Ratio. Intraday Traders Can Keep An Eye On 24624, Which Acts As An Intraday Trend Change Level.
Nifty Intraday Trading Levels
Buy Above 24824 Tgt 24860, 24900 and 24944 ( Nifty Spot Levels)
Sell Below 24777 Tgt 24729, 24685 and 24630 (Nifty Spot Levels)
Wishing you good health and trading success as always.As always, prioritize your health and trade with caution.
As always, it’s essential to closely monitor market movements and make informed decisions based on a well-thought-out trading plan and risk management strategy. Market conditions can change rapidly, and it’s crucial to be adaptable and cautious in your approach.
► Join Youtube channel : Click here
► Check out Gann Course Details: W.D. Gann Trading Strategies
► Check out Financial Astrology Course Details: Trading Using Financial Astrology
► Check out Gann Astro Indicators Details: Gann Astro Indicators