


Weekly Astro-Trading Outlook: Mercury Enters Taurus, Full Moon & Gann Trend Change Date
“Astrology reveals the when. Gann shows the where. Trading success lies in decoding both.”
As we head into a crucial week for Nifty & Bank Nifty, traders should be alert to celestial signals that could mark important shifts in trend. The combination of Mercury’s zodiac transition, a Full Moon, and a Gann trend change date makes this a time window not to ignore.
Key Astro Events & Trading Implications
Mercury Sign Change to Taurus
Mercury governs communication, trading, and sentiment. Its ingress into the earthy sign Taurus suggests:
-
More grounded but slower decision-making in markets
-
Strong focus on banking, FMCG, and infrastructure stocks
-
Watch for sector rotation and profit booking in tech-heavy counters
Full Moon (Lunar Energy Peak)
Full Moons tend to coincide with emotional extremes and price peaks or troughs.
→ Watch for gap-ups/downs or false breakouts—especially in the first 30 minutes of the session.
Mercury Square Pluto
This tense aspect brings mental tension, hidden information surfacing, and unexpected market reactions.
→ Ideal for news-based whipsaws or surprise reversals on intraday charts.
Bayer Rule 5:
“Mercury Retrograde Zodiacal Position of One Year”
This rule implies markets may echo price behavior of the same zodiac zone during last Mercury retrograde, offering clues to directional bias.
→ Check what happened last time Mercury was in Taurus during retrograde—history could rhyme.
Gann Squaring Trend Change Date
This week also activates a critical Gann Time Squaring Window. These dates often mark midpoints of cycles and frequently coincide with major highs or lows.
Watch full explanation in the video below:
W.D. Gann Trading Strategies
Financial Astrology Course & Insights
SENSEX Harmonic Pattern
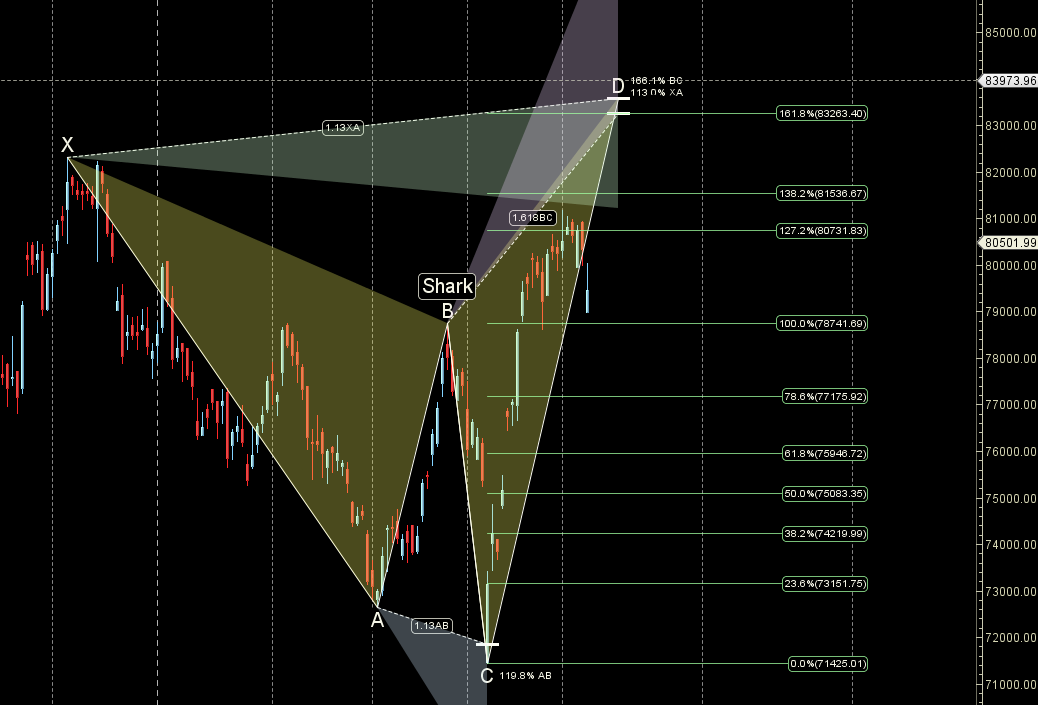
Shark Pattern PRZ zone around 83000 once above 80000
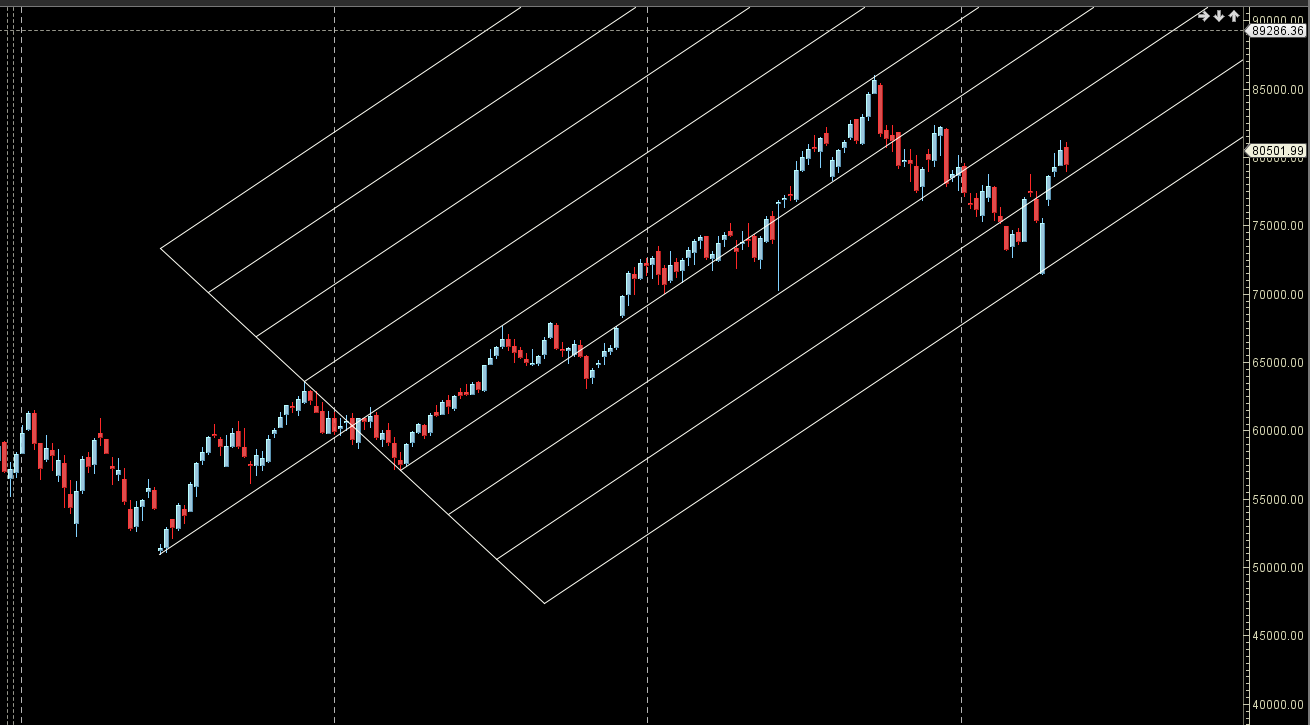
SENSEX Gann Angles
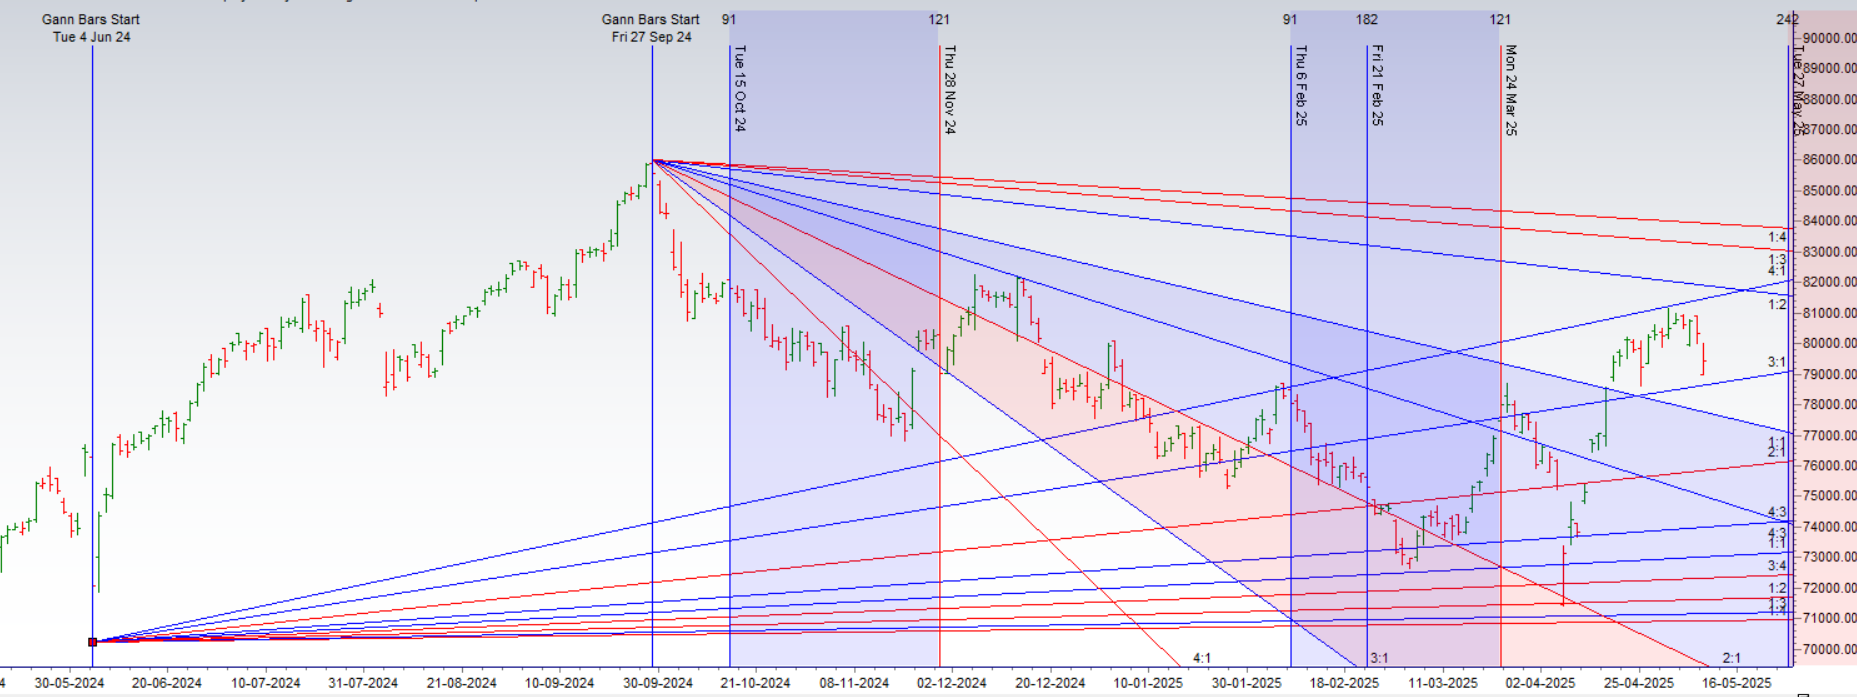
Price is near its 3×1 gann angle support zone.
SENSEX Supply and Demand
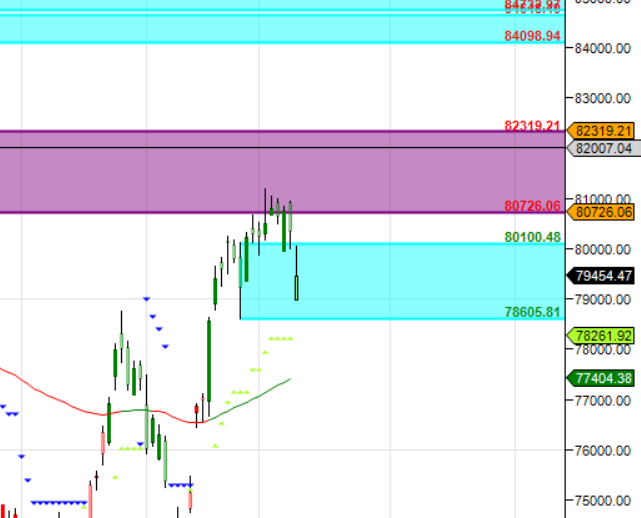
Self Explanatory Chart
SENSEX Time Analysis Pressure Dates
12 May is the Important Gann/Astro Date for coming week.
SENSEX Weekly Chart
Price has closed above Weekly above AF support zone.
SENSEX Monthly Charts
82400 is Monthly resistance zone 79500 is Support zone.
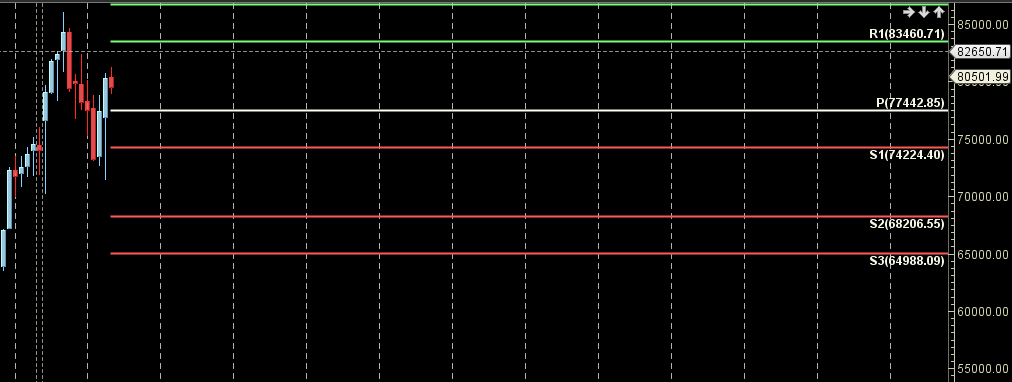
SENSEX Weekly Levels
SENSEX Trend Deciding Level: 80092
SENSEX Resistance: 80373,80654,80935,81216
SENSEX Support:79811,79530,79249,78968
Learn More:
W.D. Gann Trading Strategies – Learn how to decode markets using price, time, and geometry.
Trading Using Financial Astrology – Discover how planetary motion impacts market behavior and how to trade it effectively.
Ready to Trade Like a Time-Master?
Join our one-on-one mentorship to master astro-timing, Gann analysis, and institutional-grade setups.
Call: 09985711341
Email: bhandaribrahmesh@gmail.com