


SENSEX Daily Gann Chart

Price is near its 1×2 resistance zone 79507 is the zone of resistane.
SENSEX Daily Swing Chart
79507-79108 is confluence of gann price resistance zone.
SENSEX Musical Level Chart
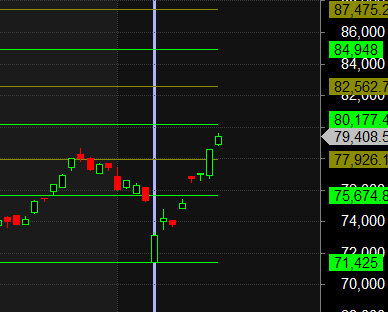
Traders who follow the musical octave trading path may find valuable insights in predicting Nifty’s movements. According to this path, SENSEX may follow a path of 82562-80177-77926 This means that traders can take a position and potentially ride the move as SENSEX moves through these levels.Of course, it’s important to keep in mind that trading is inherently risky and market movements can be unpredictable.
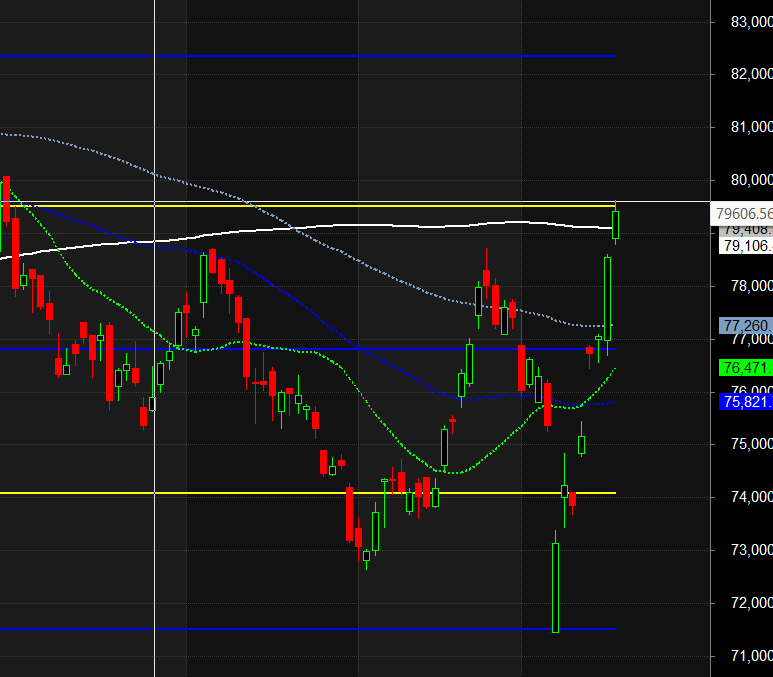
SENSEX MA Chart

Price is above all short and long term MA any fall till 78600 will be bought into.
SENSEX Intraday Time :
Traders may watch out for potential intraday reversals at 09:15,10:24,12:15,01:29,02:11 How to Find and Trade Intraday Reversal Times
SENSEX Expiry Range
Upper End of Expiry : 79632
Lower End of Expiry : 78368
SENSEX Intraday Trading Levels
Buy Above 79000 Tgt 79205, 79400 and 79632 ( SENSEX Spot Levels)
Sell Below 78911 Tgt 78729, 78555 and 78368 (SENSEX Spot Levels)
Wishing you good health and trading success as always.As always, prioritize your health and trade with caution.
As always, it’s essential to closely monitor market movements and make informed decisions based on a well-thought-out trading plan and risk management strategy. Market conditions can change rapidly, and it’s crucial to be adaptable and cautious in your approach.
► Join Youtube channel : Click here
► Check out Gann Course Details: W.D. Gann Trading Strategies
► Check out Financial Astrology Course Details: Trading Using Financial Astrology
► Check out Gann Astro Indicators Details: Gann Astro Indicators