


MCX GOLD Gann Angle Chart

Gold has bounced from its 4×3 gann angle support zone and now will face resistance in zone of 95859-96000.
MCX GOLD Supply Demand Zone

MCX GOLD Supply Demand Chart : Demand in range of 94240-94150, Supply in range of 95859-96000
MCX GOLD Harmonic Analysis

Almost near compeltion of ABCD pattern around 95889/96000.
MCX GOLD Gann Swing Levels

Till 94279 is held rally towards 96800/96500/97000. Break of 94000 on daily closing basis can lead to fall towards 91000.
MCX GOLD EW Analysis
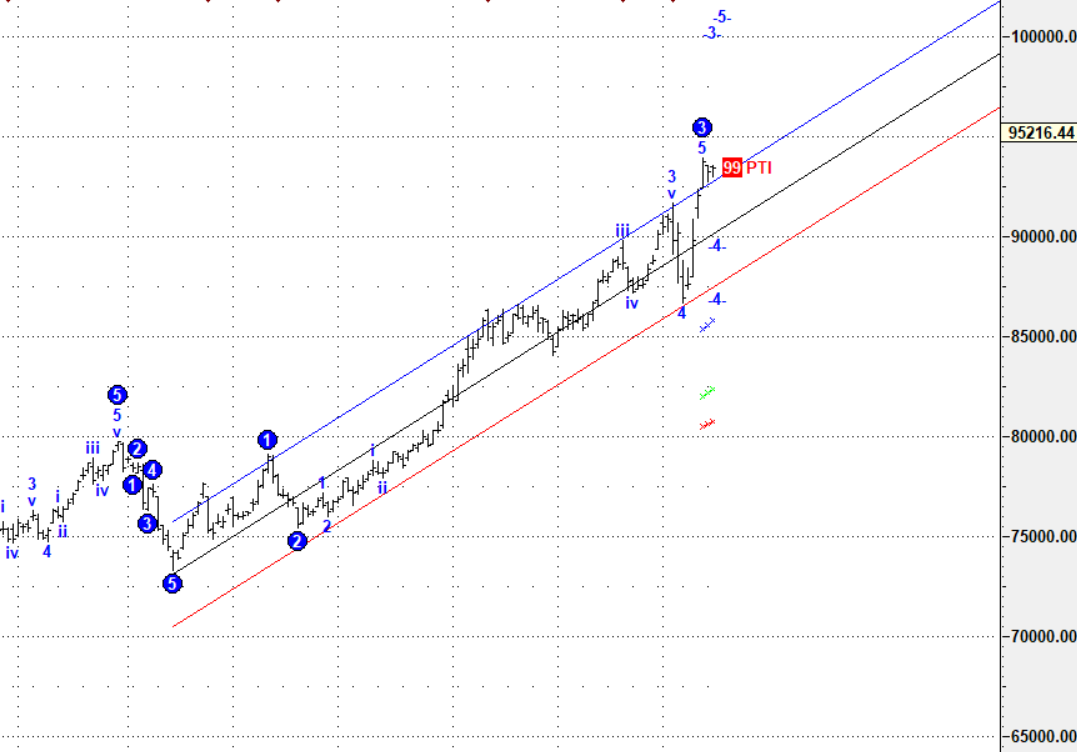
5 wave almost near completion.
GOLD Astro/Gann Trend Change Date
21 April Important Gann/Astro Date for Trend Change
Weekly Trend Change Level:95769
Weekly Resistance:96338,97010,97634,98260
Weekly Support: 95151,94535,93921,93303
Levels Mentioned are for Current Month Future
Learn More:
W.D. Gann Trading Strategies – Learn how to decode markets using price, time, and geometry.
Trading Using Financial Astrology – Discover how planetary motion impacts market behavior and how to trade it effectively.
Ready to Trade Like a Time-Master?
Join our one-on-one mentorship to master astro-timing, Gann analysis, and institutional-grade setups.
Call: 09985711341
Email: bhandaribrahmesh@gmail.com
Wishing you good health and trading success as always.As always, prioritize your health and trade with caution.
As always, it’s essential to closely monitor market movements and make informed decisions based on a well-thought-out trading plan and risk management strategy. Market conditions can change rapidly, and it’s crucial to be adaptable and cautious in your approach.
Trade smartly and safely.