


MCX GOLD Gann Angle Chart
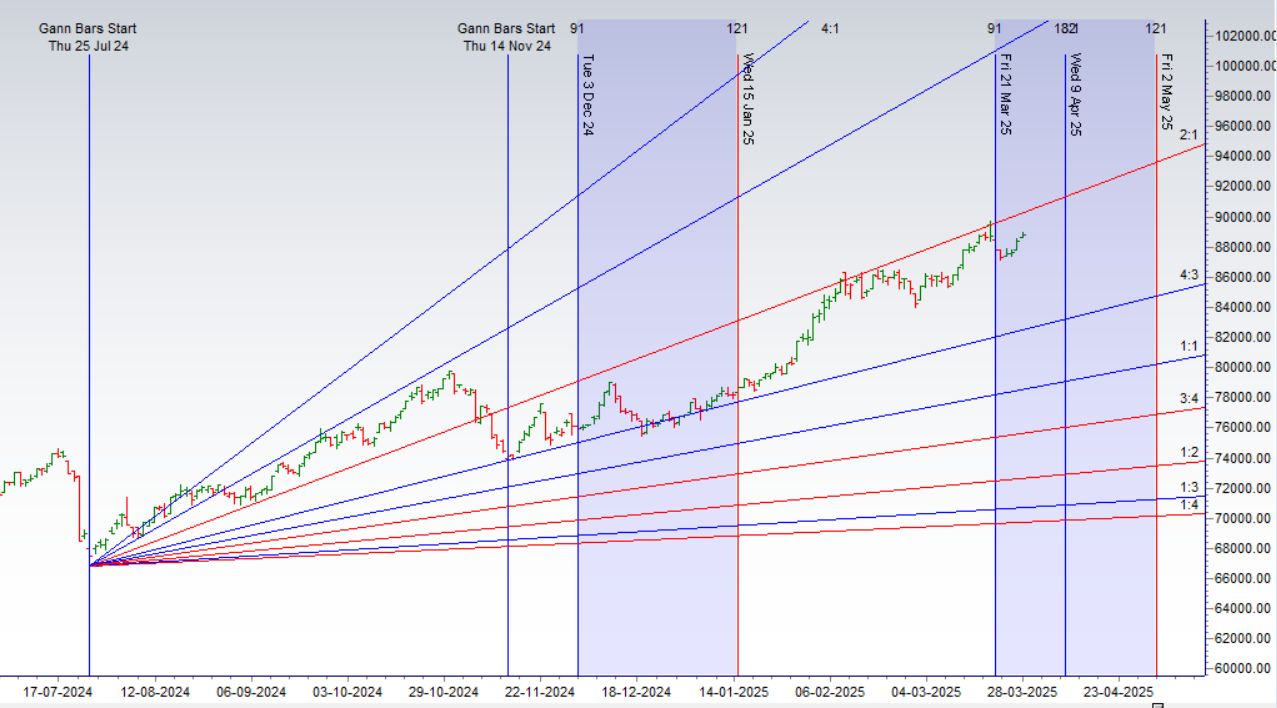
Gold is again going back towards its 2×1 resistabce zone of 91125
MCX GOLD Supply Demand Zone
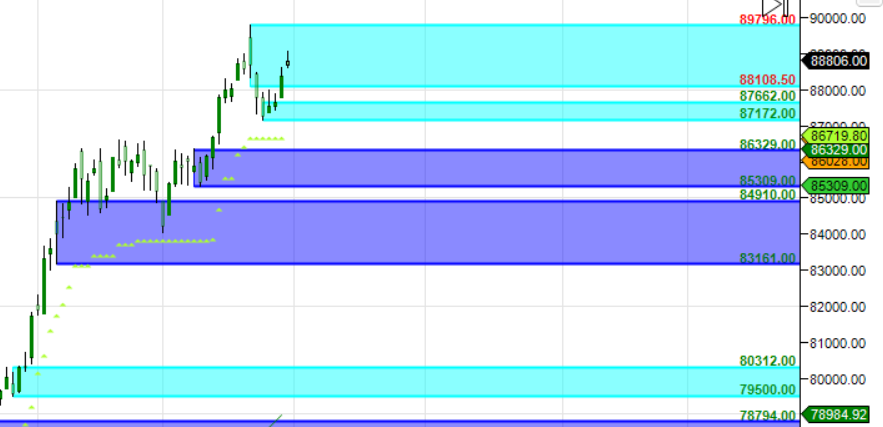
MCX GOLD Supply Demand Chart : Demand in range of 88108-88200, Supply in range of 91125-91200
MCX GOLD Harmonic Analysis
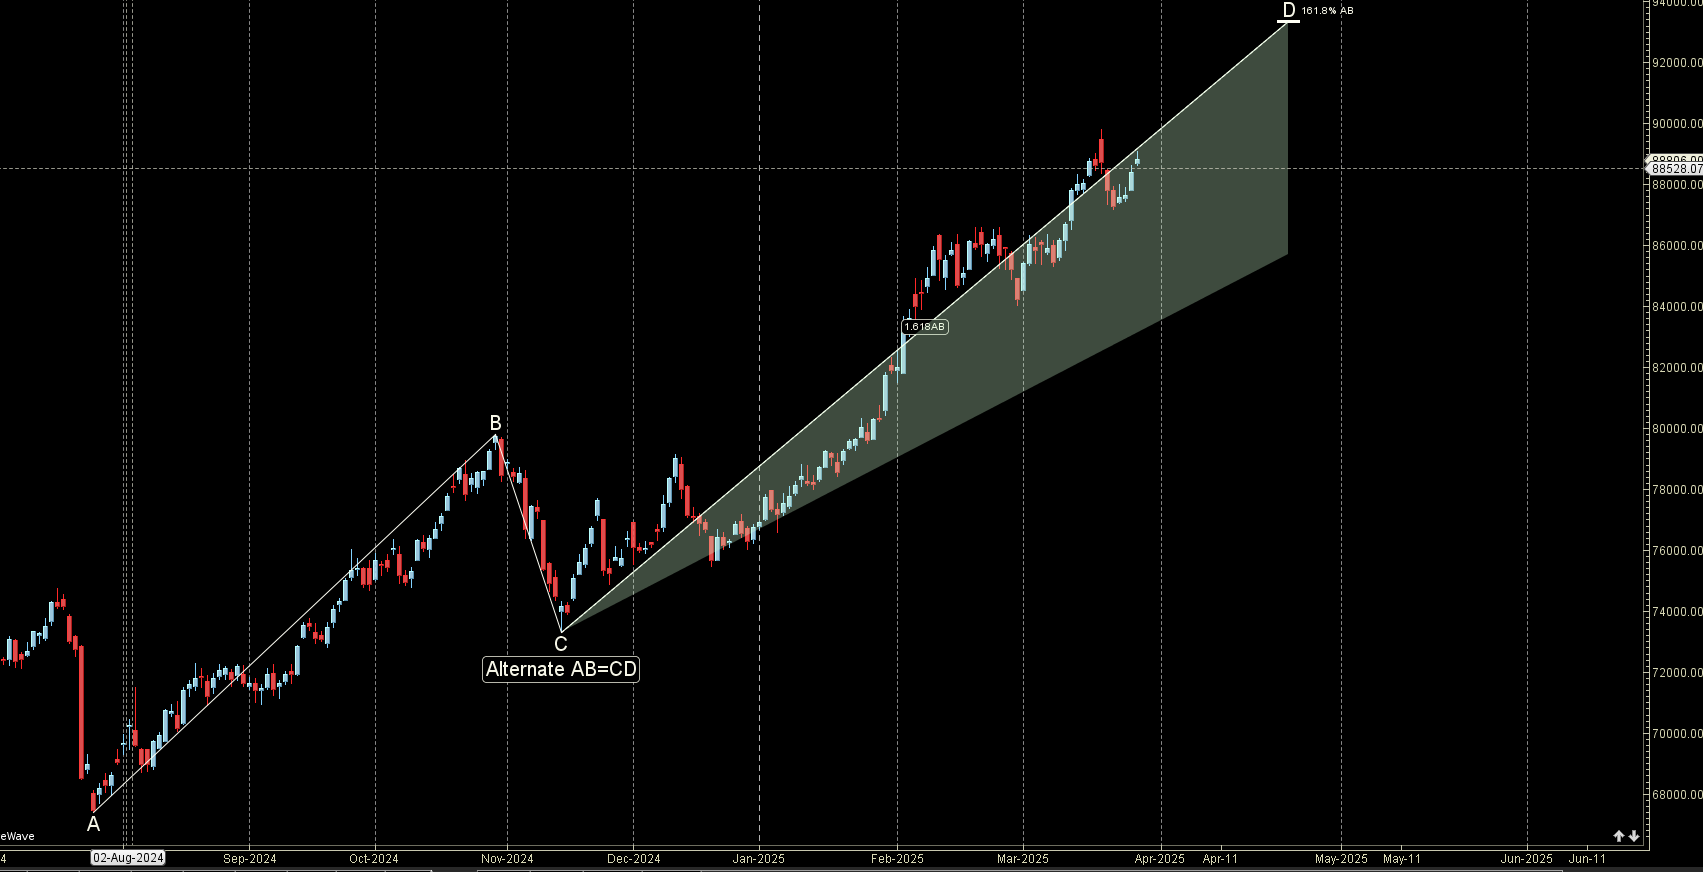
Gold completed the pullback and now back to rally towards 92500-93000.
MCX GOLD EW Analysis
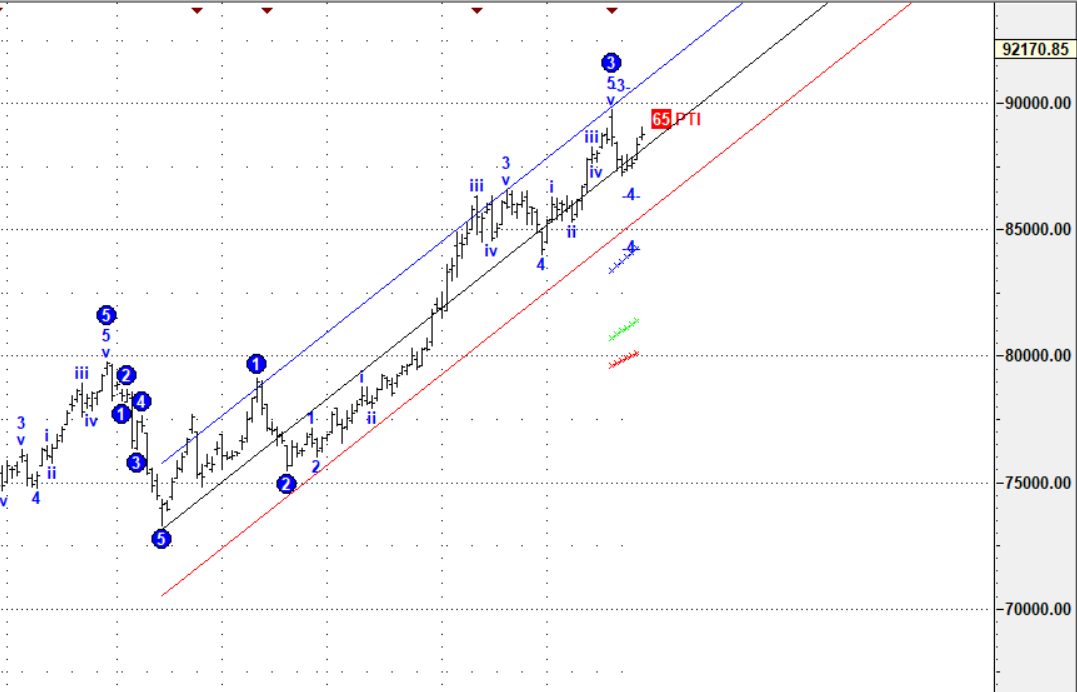
4 wave completed now back to 5 wave for a new high towards 91125
GOLD Astro/Gann Trend Change Date
02 April Important Gann/Astro Date for Trend Change
Weekly Trend Change Level:89550
Weekly Resistance:90149,90751,91354,91960
Weekly Support: 88952,88357,87763,87172
Levels Mentioned are for Current Month Future
Wishing you good health and trading success as always.As always, prioritize your health and trade with caution.
As always, it’s essential to closely monitor market movements and make informed decisions based on a well-thought-out trading plan and risk management strategy. Market conditions can change rapidly, and it’s crucial to be adaptable and cautious in your approach.
Trade smartly and safely.