


These astrological events indicate a highly volatile and significant week for the markets. Here’s a breakdown of their potential impact:
Key Astrological Events & Market Implications (17-21 March 2025)
-
Mercury Retrograde in Aries
- Expect miscommunication, rapid reversals, and false breakouts.
- Market sentiment may shift unexpectedly, leading to whipsaws.
-
Sun Ingress in Aries
- A shift in energy, marking a potential turning point.
- Could coincide with a new trend formation, especially in indices.
-
Moon Apogee (Farthest Point from Earth)
- Historically, markets tend to be sluggish or show consolidation.
- A reversal could follow if combined with other planetary triggers.
-
Sun Conjunct North Node
- Brings a fated element to price action.
- Often aligns with key highs or lows, signaling a change in direction.
-
Sun Conjunct Neptune
- Creates confusion, illusions, and fake moves.
- Watch for deception in price action—sharp sell-offs or euphoric rallies.
-
Total Lunar Eclipse
- Highly significant; often marks major market turning points.
- Historically linked to volatility, panic selling, or euphoric buying.
-
Bayer Rule 38: Mercury Latitude Heliocentric
- “Mighty fine tops and bottoms” suggest key reversals.
- Track how Mercury interacts with specific degrees for high-accuracy trades.
-
Bayer Rule 2: Mars-Mercury Speed Difference of 59 Minutes
- Trend likely turns down within 3 days.
- Often leads to a big move—watch for breakdown confirmations.
-
Neptune Apogee
- Neptune’s influence can lead to market delusions or speculative spikes.
- Often coincides with irrational market behavior, followed by corrections.
Trading Strategy for the Week
- Expect high volatility with potential reversals.
- Watch for false breakouts due to Mercury Retrograde.
- Pay attention to the Lunar Eclipse and Sun-Node-Neptune conjunction, as these could trigger a trend shift.
- Shorting opportunities may arise based on Bayer Rule 2 and Mercury’s latitude motion.
- Monitor Mars-Mercury speed differences for confirmation of a downtrend.
Astro analysis can help identify trends and reversals in the market, and it can be used in combination with other technical analysis methods to improve the accuracy of trading strategies. Gann analysis involves studying charts and identifying support and resistance levels to pinpoint potential trading opportunities.
SENSEX Harmonic Pattern

CYPHER Pattern completed and Price is heading towards 76000 till holding 73500.
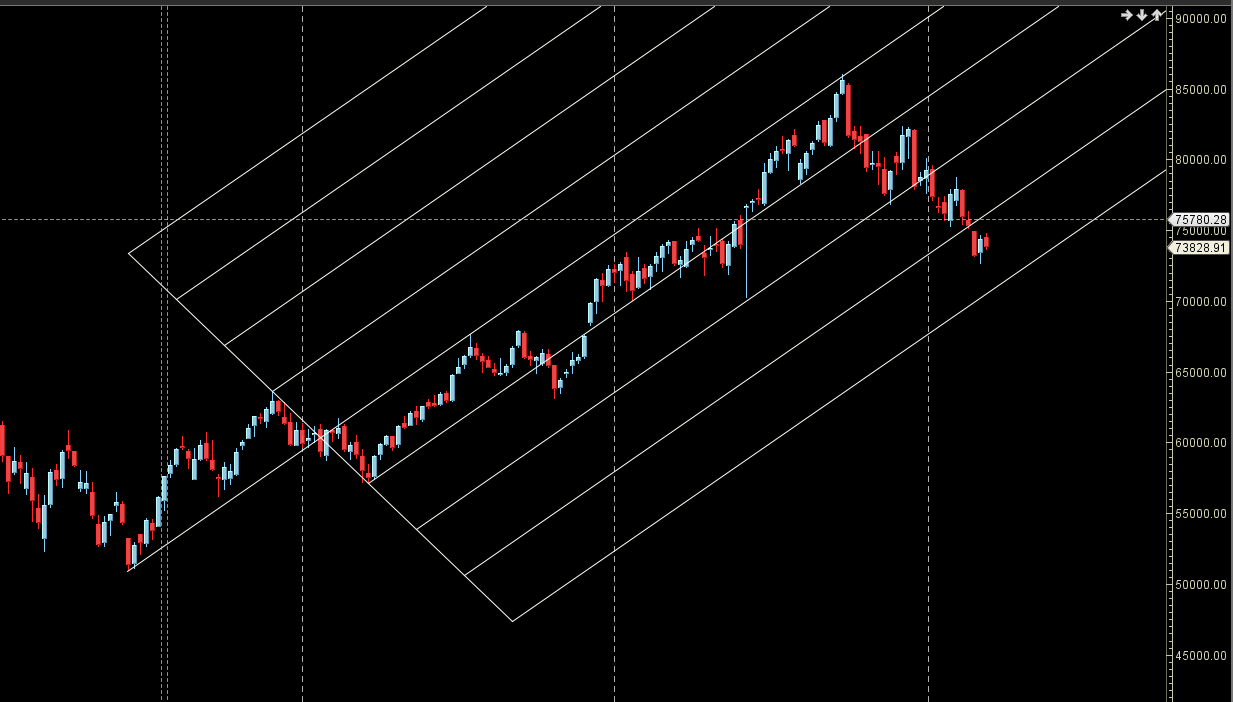
SENSEX Gann Angles
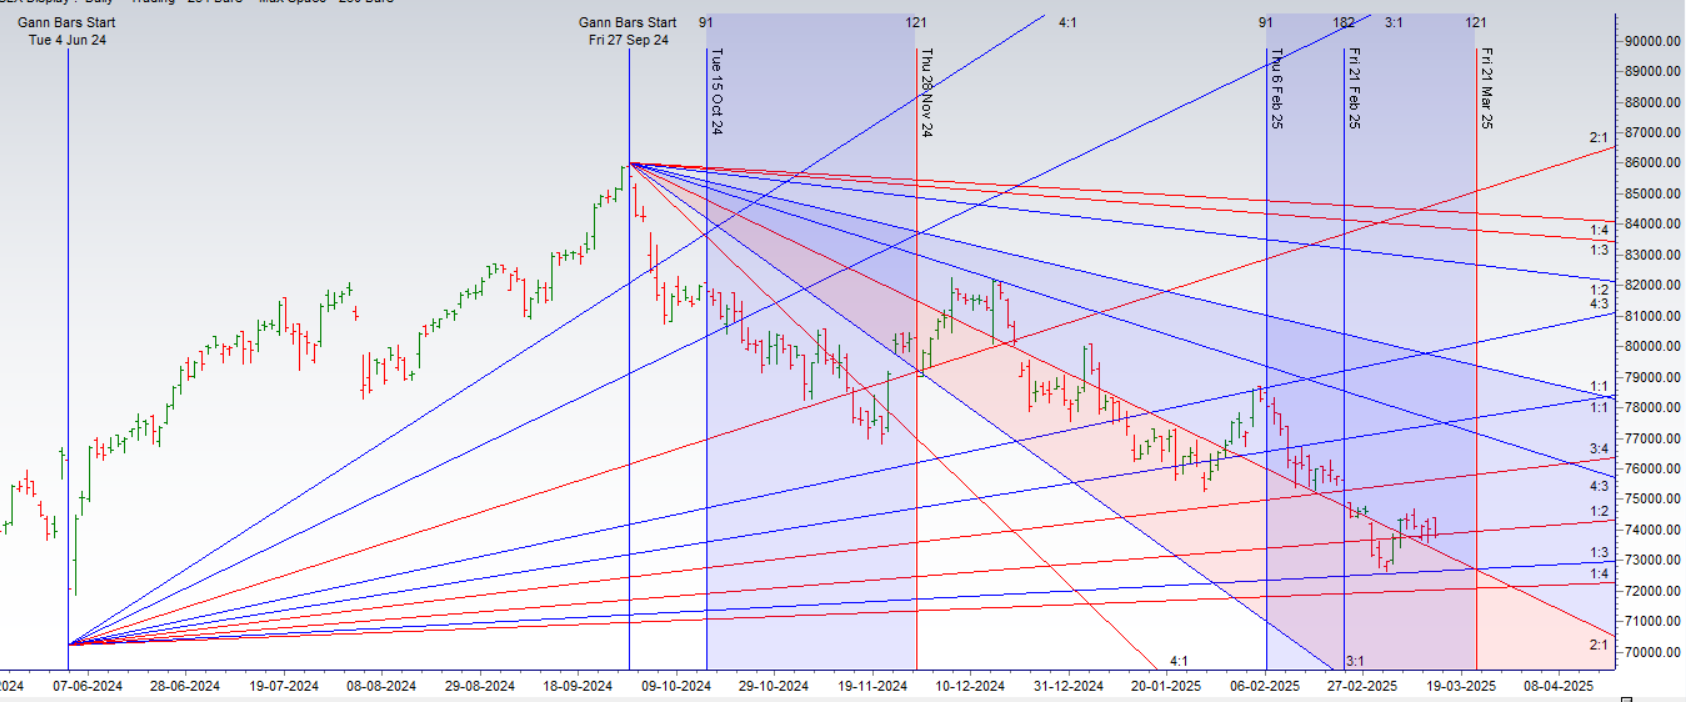
Price is heading towards 3×4 gann angle at 76000 till holding 73500.
SENSEX Supply and Demand
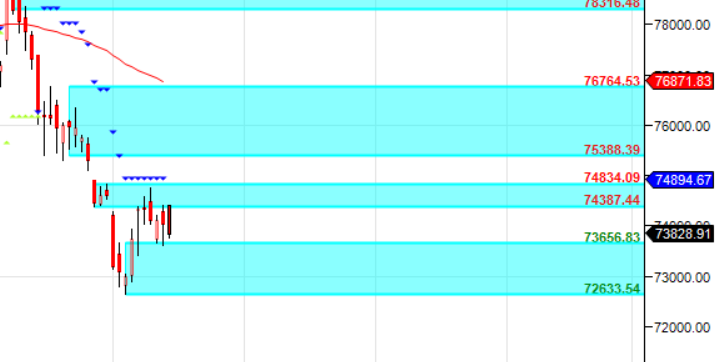
Self Explanatory Chart
SENSEX Time Analysis Pressure Dates
17/21 March is the Important Gann/Astro Date for coming week.
SENSEX Weekly Chart
Price has formed a Pause Candel on Weekly Chart
SENSEX Monthly Charts

75024 is Monthly resistance zone 73500 is Support zone.