FII Activity: Bearish Sentiment in Nifty Index Futures
Foreign Institutional Investors (FIIs) displayed a bearish approach in the Nifty Index Futures market by shorting 23114 contracts worth ₹1459 crores. This resulted in a increase of 17674 contracts in the net open interest.
FIIs covered 240 long contracts and added 23762 short contracts, reflecting a preference for reducing their long exposure while increasing their short positions in Nifty Futures. The net FII long-short ratio is 0.69, indicating a more bearish stance.
On the other hand, Clients added 18159 long contracts and added 8053 short contracts, showing bullish and bearish positioning ias part of their trading strategy.
Current Positioning in Index Futures:
- FIIs: Holding 33% long and 67% short positions.
- Clients: Holding 65% long and 35% short positions.
Analysis:
FIIs are showing a more bearish bias, with a higher percentage of short positions. Meanwhile, clients remain more optimistic, holding a larger percentage of long positions.
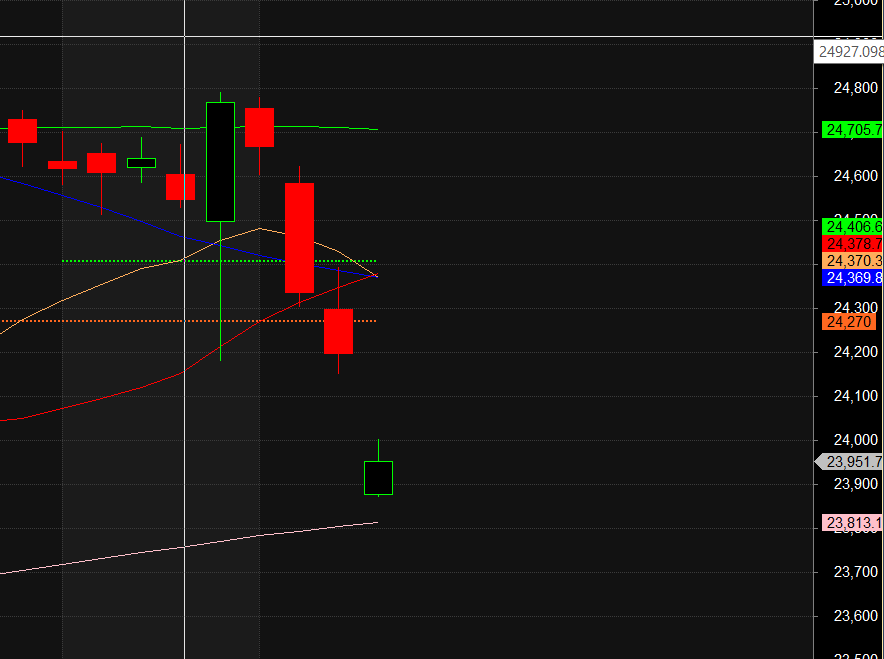
Bayer’s Rule once again proved effective in capturing the trend, as discussed earlier. The price convincingly closed below 24,250, signaling further downside, and with today’s gap-down opening, bears are expected to take control. Astro and Gann levels continue to provide an additional edge in identifying key market moves.
Key Factors to Watch Today:
- Weekly Expiry: Today being a weekly expiry, heightened volatility is expected.
- Fed Surprise: The Fed delivered an unexpected decision yesterday, with no rate cuts, adding to global market uncertainty.
- Critical 200 SMA Level: The price is approaching the 200 SMA at 23,803.
- A close below 23,803 could signal more pain, with potential downside toward the last swing low of 23,180.
- Bulls need a close above 24,000 to regain control and initiate any meaningful upside.
Traders should stay cautious and monitor these critical levels closely, as the market navigates through expiry-related volatility and global macro influences.
Boost Your Trading Success with Mission-Vision Statements: A Guide to Clarity and Consistency
Nifty has experienced a sharp decline of 3.3% over the last four trading sessions, coinciding with the confluence of astro and Gann dates on Monday. This pivotal alignment has clearly shown its impact on market dynamics.
Key Levels for Tomorrow’s Weekly Close
As we approach the weekly close, the 24000-24040 is a critical zone for the bulls to defend. A close above this range would signal strength and set the stage for a potential recovery.
On the other hand, bears will aim to push the index below 23870, paving the way for another significant move next week.
Winter Solstice: An Important Time Cycle Ahead
Next week, the market will also factor in the Winter Solstice, a major time cycle event. Historically, such events have been known to trigger significant market volatility, adding weight to the importance of tomorrow’s close.
Outlook
Traders should keep a close watch on these key levels during tomorrow’s session. A decisive weekly close in either direction could provide clues about the trend for the coming week.
Nifty Trade Plan for Positional Trade ,Bulls will get active above 24004 for a move towards 24082/24160. Bears will get active below 23925 for a move towards 23847/23729
Traders may watch out for potential intraday reversals at 10:02,11:31,12:31,02:33 How to Find and Trade Intraday Reversal Times
Nifty December Futures Open Interest Volume stood at 1.07 lakh cr , witnessing liquidation of 2.1 Lakh contracts. Additionally, the increase in Cost of Carry implies that there was covering of SHORT positions today.
Nifty Advance Decline Ratio at 13:37 and Nifty Rollover Cost is @25178 closed below it.
Nifty Gann Monthly Trade level :24406 close below it.
Nifty has closed below its 20/50/100 SMA @ 24270 Trend has changed to Sell on Rise till below 24000.
Nifty options chain shows that the maximum pain point is at 24000 and the put-call ratio (PCR) is at 0.62 Typically, when the PCR open interest ranges between 0.90 and 1.05, the market tends to remain range-bound.
Nifty 50 Options Chain Analysis
The Nifty 50 options chain indicates that the highest open interest (OI) on the call side is at the 24000 strike, followed by 24100 strikes. On the put side, the highest OI is at the 23800 strike, followed by 23700 strikes. This suggests that the market participants are expecting Nifty 50 to remain range between 23700-24100 levels.
In the cash segment, Foreign Institutional Investors (FII) sold 4224 crores, while Domestic Institutional Investors (DII) bought 3943 crores.
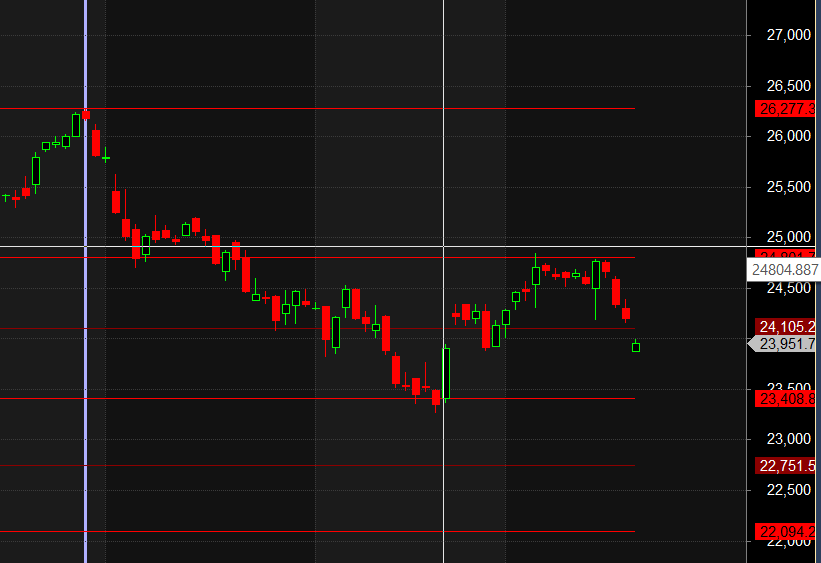
Traders who follow the musical octave trading path may find valuable insights in predicting Nifty’s movements. According to this path, Nifty may follow a path of 23408-24105-24801 This means that traders can take a position and potentially ride the move as Nifty moves through these levels.Of course, it’s important to keep in mind that trading is inherently risky and market movements can be unpredictable.
If you want to be a successful trader during a loss-making period, you need to learn the art of losing. If you condition your mind to lose without anxiety, without emotional attachment, and without the desire to get even, things will start turning around for you.
For Positional Traders, The Nifty Futures’ Trend Change Level is At 24517. Going Long Or Short Above Or Below This Level Can Help Them Stay On The Same Side As Institutions, With A Higher Risk-reward Ratio. Intraday Traders Can Keep An Eye On 23996, Which Acts As An Intraday Trend Change Level.
Nifty Intraday Trading Levels
Buy Above 23975 Tgt 24014, 24056 and 24108 ( Nifty Spot Levels)
Sell Below 23920 Tgt 23888, 23848 and 23808 (Nifty Spot Levels)
Wishing you good health and trading success as always.As always, prioritize your health and trade with caution.
As always, it’s essential to closely monitor market movements and make informed decisions based on a well-thought-out trading plan and risk management strategy. Market conditions can change rapidly, and it’s crucial to be adaptable and cautious in your approach.
Join Youtube channel : Click here
► Check out Gann Course Details: W.D. Gann Trading Strategies
► Check out Financial Astrology Course Details: Trading Using Financial Astrology
► Check out Gann Astro Indicators Details: Gann Astro Indicators


