


The following astrological events are lined up for the upcoming week, indicating the potential for heightened market volatility, especially after Friday’s wild move:
- Full Moon
- Mercury Turning Direct
- Mercury Extreme Declination
- Bayer’s Rule No. 38:“Some mighty fine tops and bottoms are produced when Mercury, in this motion, passes the mentioned degrees.”
- Moon Conjunct Mars
- Gann Emblem Date
These events suggest that the market could witness sharp reversals and increased momentum. Combining astrological insights with technical analysis can help traders identify key opportunities during this period of expected volatility.
Astro analysis can help identify trends and reversals in the market, and it can be used in combination with other technical analysis methods to improve the accuracy of trading strategies. Gann analysis involves studying charts and identifying support and resistance levels to pinpoint potential trading opportunities.
Nifty Harmonic Pattern
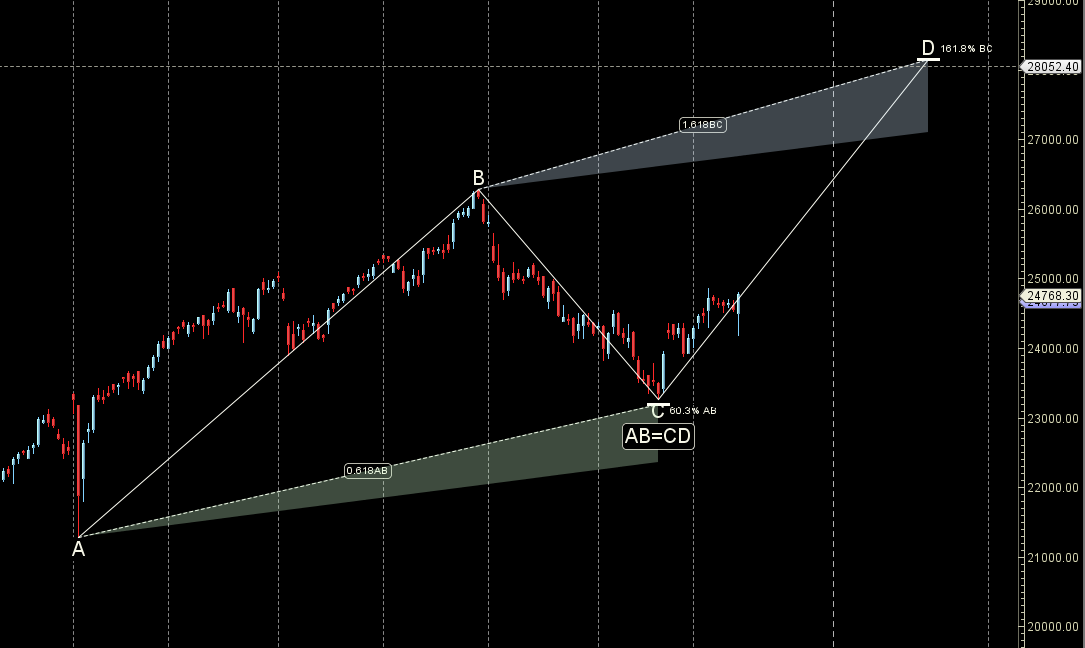
Price reacted from the PRZ zone of 24200 heading towards 25000-25251 zone.
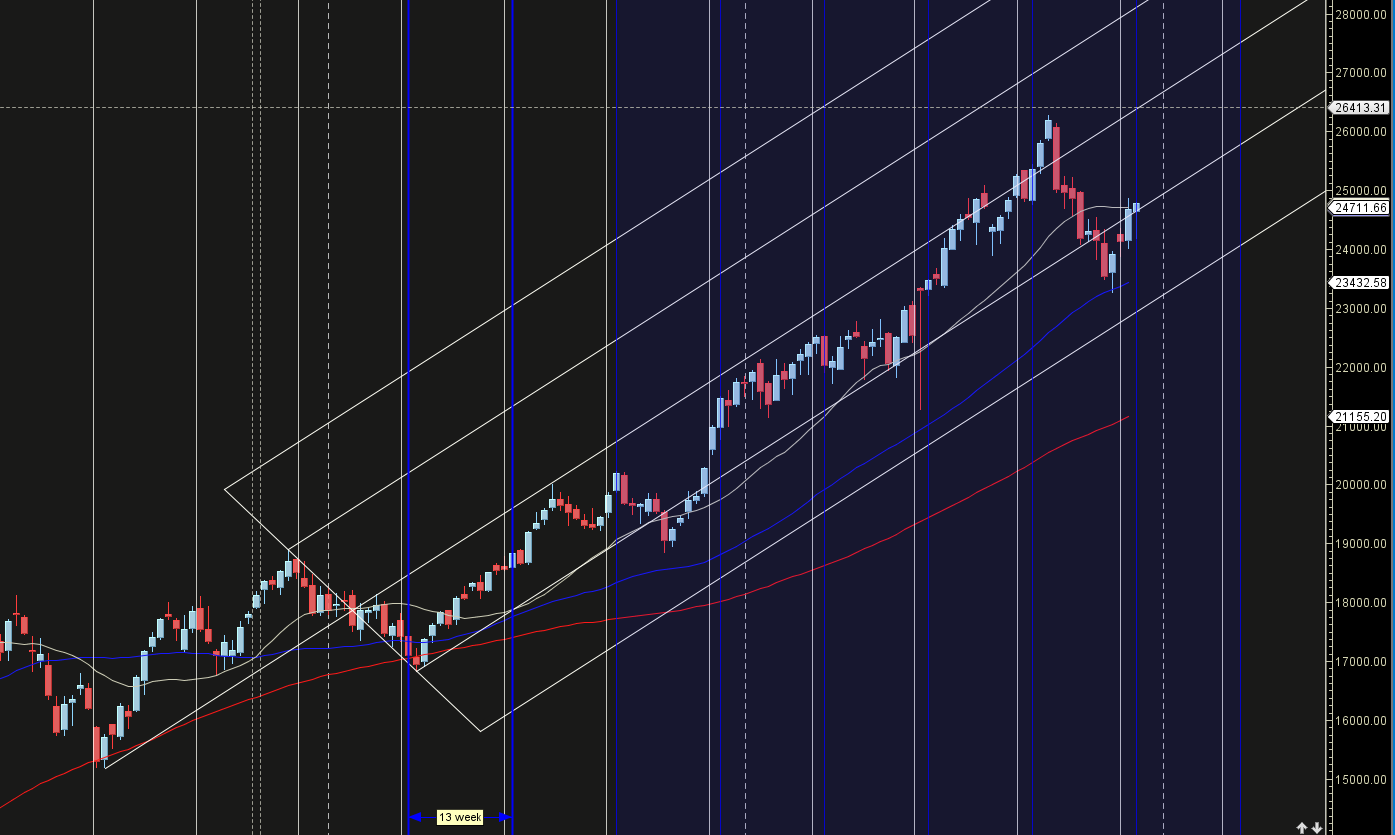
Nifty Gann Angles

Price has closed above 3×4 gann angle support zone till above 3×4 zone heading towards its all time high of 26277.
Nifty Supply and Demand
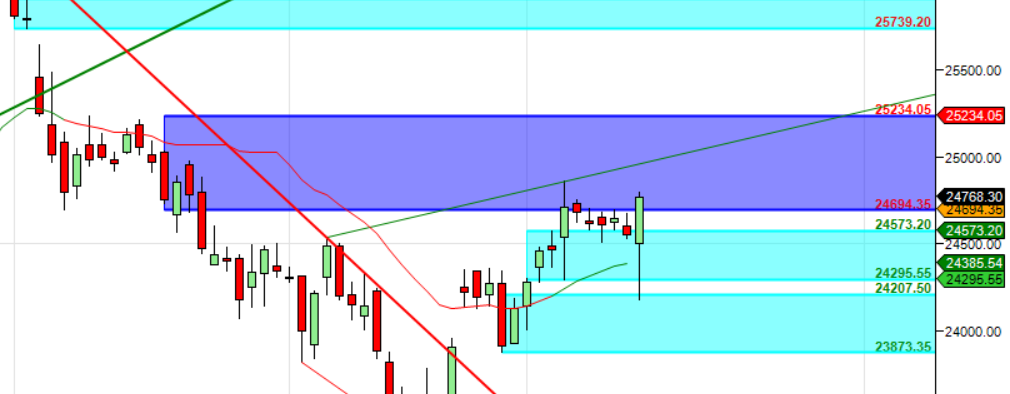
Self Explanatory Chart
Nifty Time Analysis Pressure Dates
16 December is the Important Gann/Astro Date for coming week.
Nifty Weekly Chart
Price has formed a Weekly Inside Bar above AF zone.
Nifty Monthly Charts

25251 is Monthly resistance zone 23977 is Support zone.
Does the nifty weekly levels exactly same as last week?
yes
yes