The US non-farm payrolls (NFP) report for August came in line with expectations, but the market’s reaction was far from muted. Traders, seemingly anticipating a worse-than-expected outcome, had built up a significant bearish position. However, the relatively benign data triggered a sharp reversal, sending equities, currencies, and commodities tumbling. The US dollar strengthened markedly, buoyed by rising US Treasury yields. This, in turn, weighed heavily on oil and gold prices.
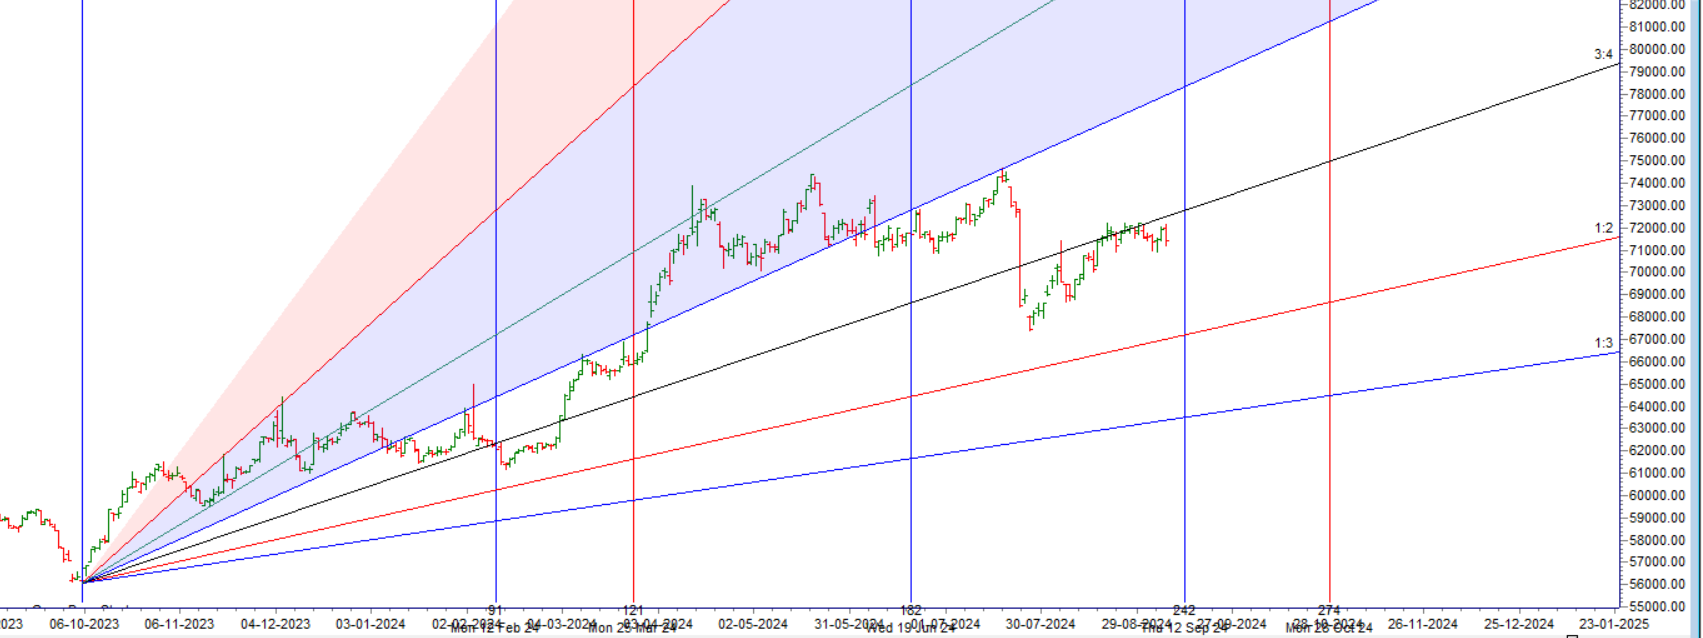
MCX GOLD Gann Angle Chart
Gold is back to 3×4 Gann Angle resistance @71500, Unable to cross than can lead to fall towards 69450.
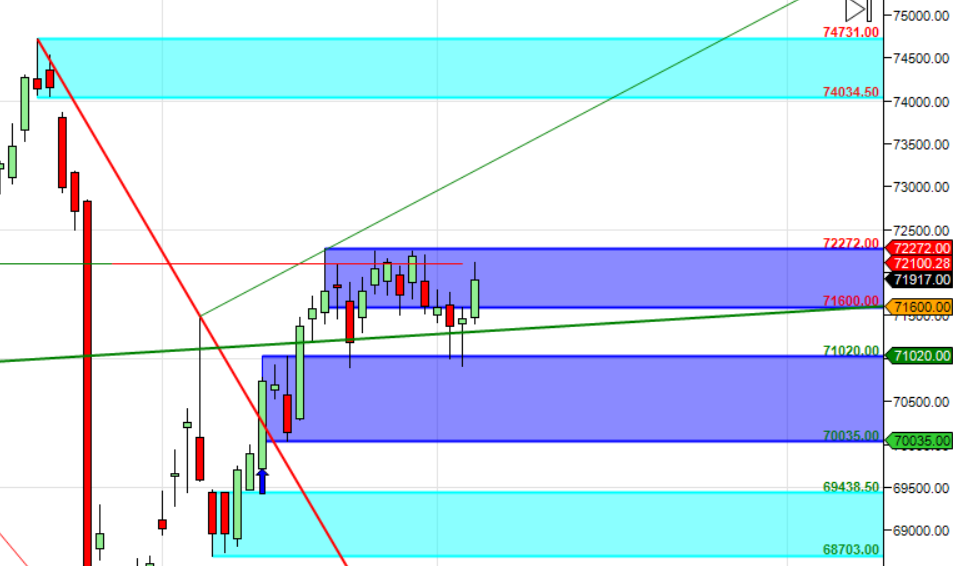
MCX GOLD Supply Demand Zone
MCX GOLD Supply Demand Chart : Demand in range of 71020-70900, Supply in range of 71900-72000
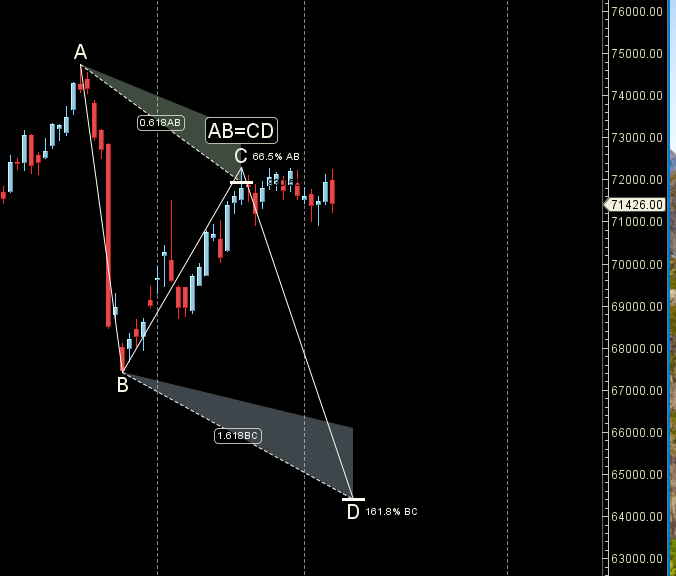
MCX GOLD Harmonic Analysis
Below 71500 price is heading towards 69500 based on Bearish ABCD Pattern.
GOLD Astro/Gann Trend Change Date
09 September Important Gann/Astro Date for Trend Change
Weekly Trend Change Level:71500
Weekly Resistance:71959,72225,72491,72757,73024
Weekly Support: 71160,70894,70659,70390,70121
Levels Mentioned are for Current Month Future
Wishing you good health and trading success as always.As always, prioritize your health and trade with caution.
As always, it’s essential to closely monitor market movements and make informed decisions based on a well-thought-out trading plan and risk management strategy. Market conditions can change rapidly, and it’s crucial to be adaptable and cautious in your approach.
Trade smartly and safely.


