


MCX GOLD Gann Angle Chart
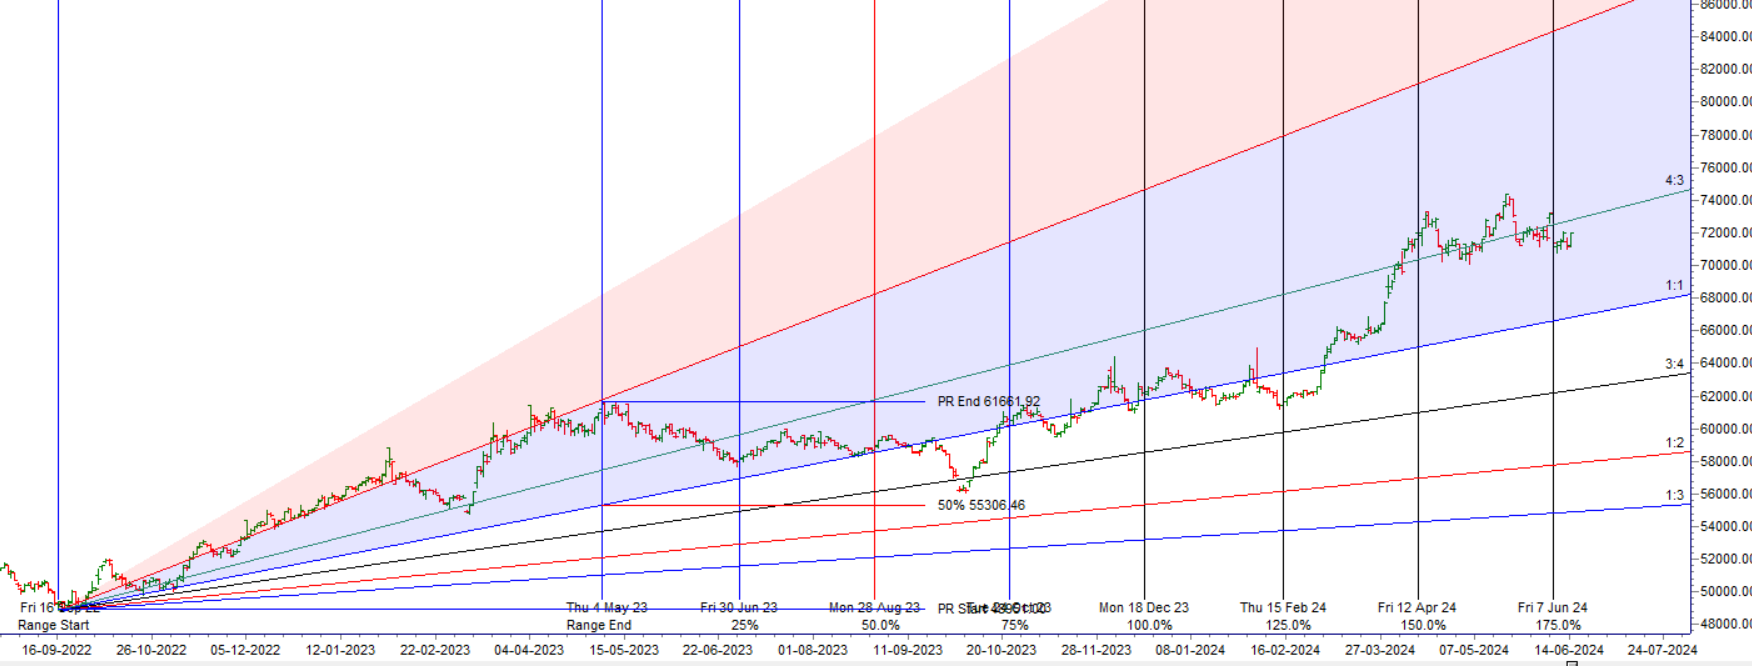
Gold has closed below its 4×3 gann angle
MCX GOLD Supply Demand Zone

MCX GOLD Supply Demand Chart : Demand in range of 70275-70108, Supply in range of 71221-71300.
MCX GOLD Harmonic Analysis

ABCD pattern is completed and price can retrace towards 69307.
GOLD Astro/Gann Trend Change Date
20 June Important Gann/Astro Date for Trend Change
Weekly Trend Change Level:71815
Weekly Resistance:72081,72347,72612,72878
Weekly Support: 71549,71283,71017,70751
Levels Mentioned are for Current Month Future
Wishing you good health and trading success as always.As always, prioritize your health and trade with caution.
As always, it’s essential to closely monitor market movements and make informed decisions based on a well-thought-out trading plan and risk management strategy. Market conditions can change rapidly, and it’s crucial to be adaptable and cautious in your approach.
Trade smartly and safely.
Excellent