In 2023, India’s prominent stock indices, Nifty 50 and BSE Sensex, witnessed a robust performance with approximately a 20% increase, marking their second-best year since 2017. Globally, they ranked among the top-performing stock indexes. Nifty soared by 3,600 points, reaching the 21,800-mark, while Sensex experienced an 11,000-point surge, surpassing the 72,000-mark.
This impressive rally was fueled by consistent domestic mutual fund inflows, a resurgence in foreign buying, better-than-expected economic growth, and strong corporate earnings.
Despite concerns about valuations, the broader small- and mid-cap segments significantly outperformed the blue-chip indexes, recording gains of about 55.62% and 46.57%, respectively.
As the financial landscape looks ahead to 2024, the crucial question on traders’ and investors’ minds is whether this euphoria will persist. Several market experts have shared their insights on this pivotal topic, shedding light on the potential trajectory of the Indian stock market.
- Saturn will spend the full year in the sign of Aquarius.
- Rahu will transit in Pisces for the entire year, with no change in the zodiac sign.
- When Jupiter transits to Taurus in May, the economy faces a crisis as Saturn and Jupiter form a square. Inflation will rise significantly ,impacting the economy even more. The relationship between Jupiter and Saturn influences the global financial climate.
Below is detailed analysis on Nifty based on various technical analysis techniques. Last Year Analysis
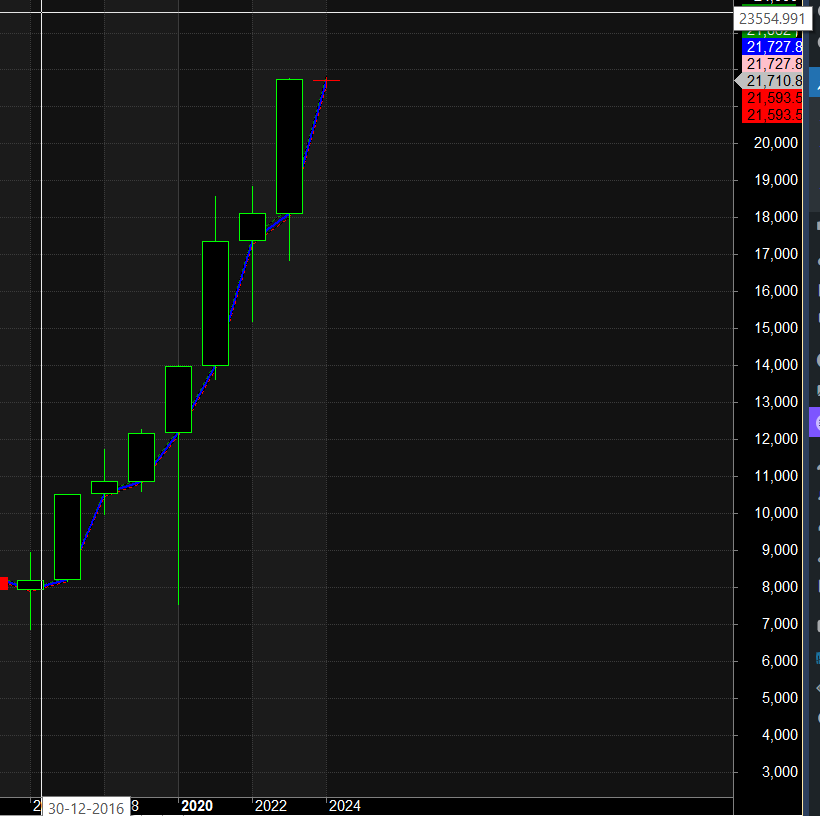
Yearly Chart

21952 is important gann number 2 day close above it rally can move towards 22484/23108. Below 18888 fall towards 17500.
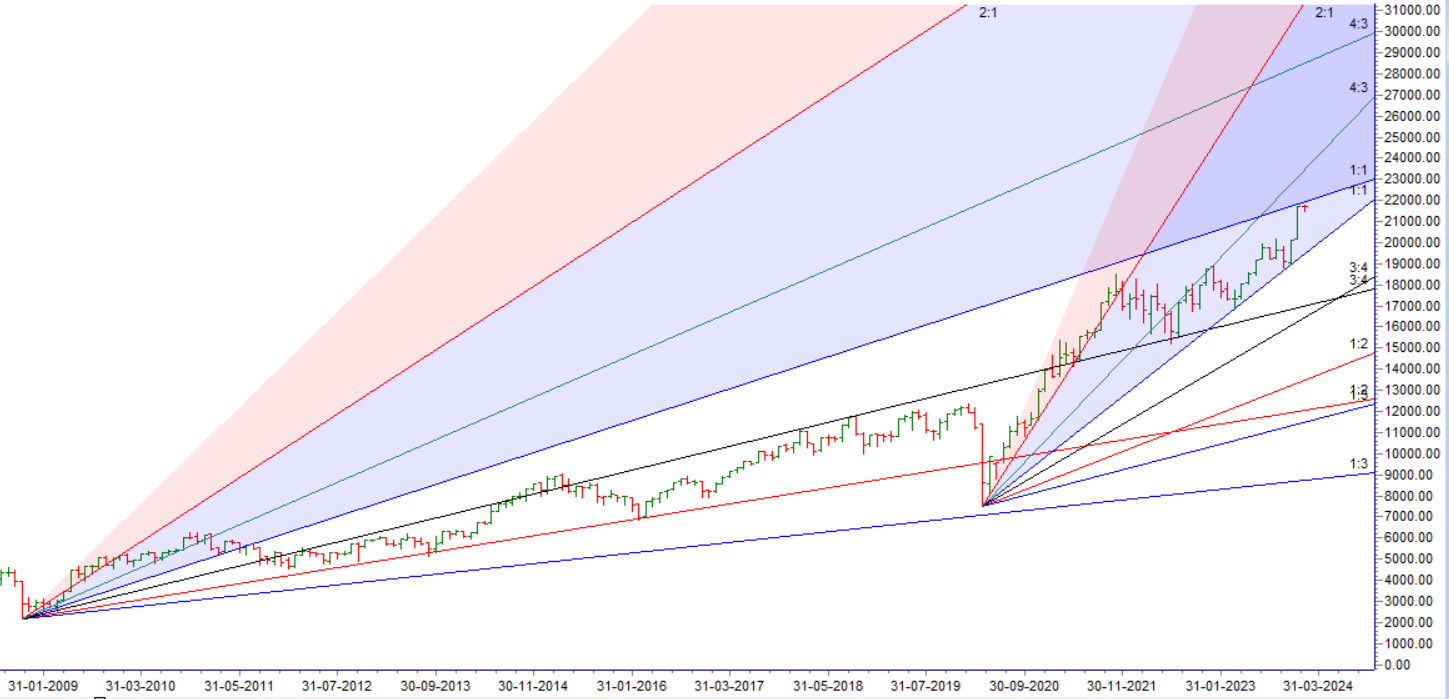
Monthly Gann Chart

Monthly Chart with Gann Angles is shown shows wide range for coming years 17576 above 19683 and below 16410 fall towards 15625
Elliot Wave Analysis

FII DATA ANALYSIS
For the year 2023, the FPIs infused $20.74 billion into Indian equities. Out of that $15.50 billion came into secondary markets while $5.24 billion came into the IPO markets. In addition, the FPIs infused $7.96 billion into debt. This takes the total FPI flows into Indian markets for the year 2023 to $28.70 billion
Harmonic Analysis

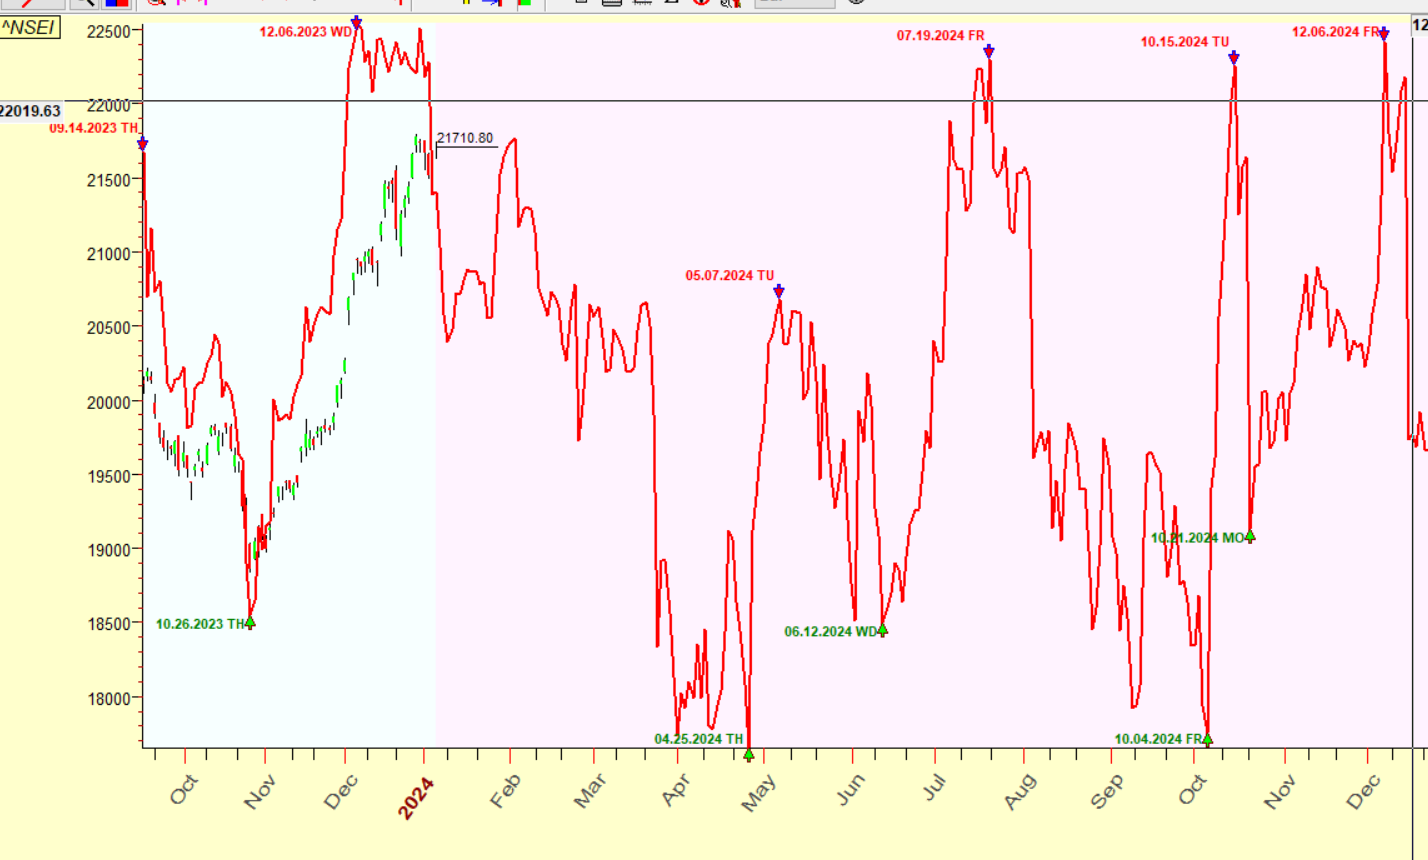
Nifty Projected Price and Time Pattern based on Neural Forecast
Below is Neural Forecast for 2024, It is not a FOOLPROOF Technique and its works 60-65% of time. So Please do not take aggresive trade without SL.

Important Pressure Dates as per Gann and Astro Analysis :
Below dates based on Astro and Gann Techniques can see Trend Change in Market.
02-Jan-24
24-Jan-24
01-Feb-24
20-Feb-24
10-Mar-24
25-Mar-24
08-Apr-24
17-May-24
14-Jun-24
24-Jun-24
02-Jul-24
12-Jul-24
05-Aug-24
01-Sep-24
05-Sep-24
18-Sep-24
03-Oct-24
17-Oct-24
11-Nov-24
19-Nov-24
07-Dec-24
23-Dec-24

year levels:16410 is the at the bottom of regression channel holding the same rally can move towards 18605/19683. Below 16410 fall towards 15500./those are old but you should update new levels for yearly
done