


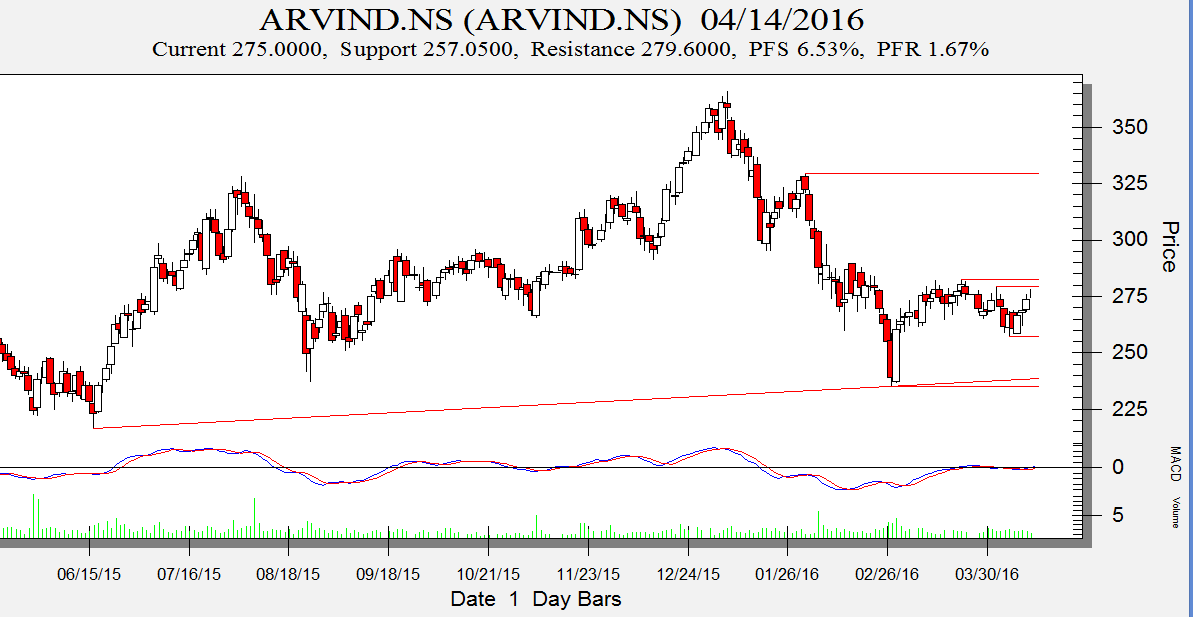
Arvind

Positional/Swing Traders can use the below mentioned levels
Close above 280 Tgt 288/297
Intraday Traders can use the below mentioned levels
Buy above 277.5 Tgt 279.6,281.2 and 283 SL 275.5
Sell below 273 Tgt 271.5,269.5 and 266 SL 275
SRF

Positional/Swing Traders can use the below mentioned levels
Holding 1366 Tgt 1453
Intraday Traders can use the below mentioned levels
Buy above 1386 Tgt 1401,1420 and 1450 SL 1380
Sell below 1375 Tgt 1364,1355 and 1330 SL 1380
Voltas
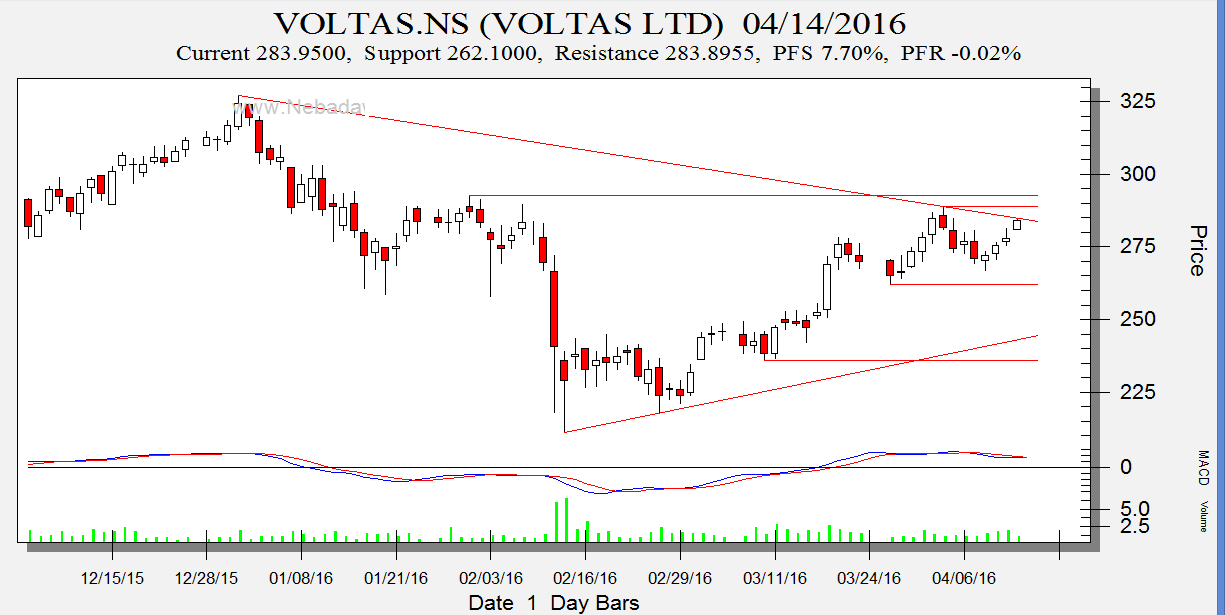
Intraday Traders can use the below mentioned levels
Buy above 286 Tgt 287.5,290 and 293 SL 284
Sell below 283 Tgt 281.5,279 and 276.5 SL 284.5
How to trade Intraday and Positional Stocks Analysis — Click on this link
Performance sheet for Intraday and Positional is updated for March Month, Intraday Profit of 3.22 Lakh and Positional Profit of 6.46 Lakh
http://tradingsystemperformance.blogspot.in/
http://stockpositionaltrading.blogspot.in/
- All prices relate to the NSE Spot/Cash Market
- Calls are based on the previous trading day’s price activity.
- Intraday call is valid for the next trading session only unless otherwise mentioned.
- Stop-loss levels are given so that there is a level below/above, which the market will tell us that the call has gone wrong. Stop-loss is an essential risk control mechanism; it should always be there.
- Book, at least, part profits when the prices reach their targets; if you continue to hold on to positions then use trailing stops to lock in your profits.
Follow on Facebook during Market Hours: https://www.facebook.com/pages/Brameshs-Tech/140117182685863
In performance sheet for april 13th it shows CESC,SRT& wockhardt
Bramesh ji, srf has bearish Butterfly on its daily chart . 1.13@1406 and 2.24BC@1388.
and has bearish butterfly on hourly 1.618xa@1399.
* Bearish Shark on daily
Thanks for sharing