
Last week we gave Chopad Levels of 8850 Nifty did 2 target on downside and 1 target on upside in a volatile week which saw swing of 272 points. Lets analyze how to trade next week.
Nifty Hourly Chart
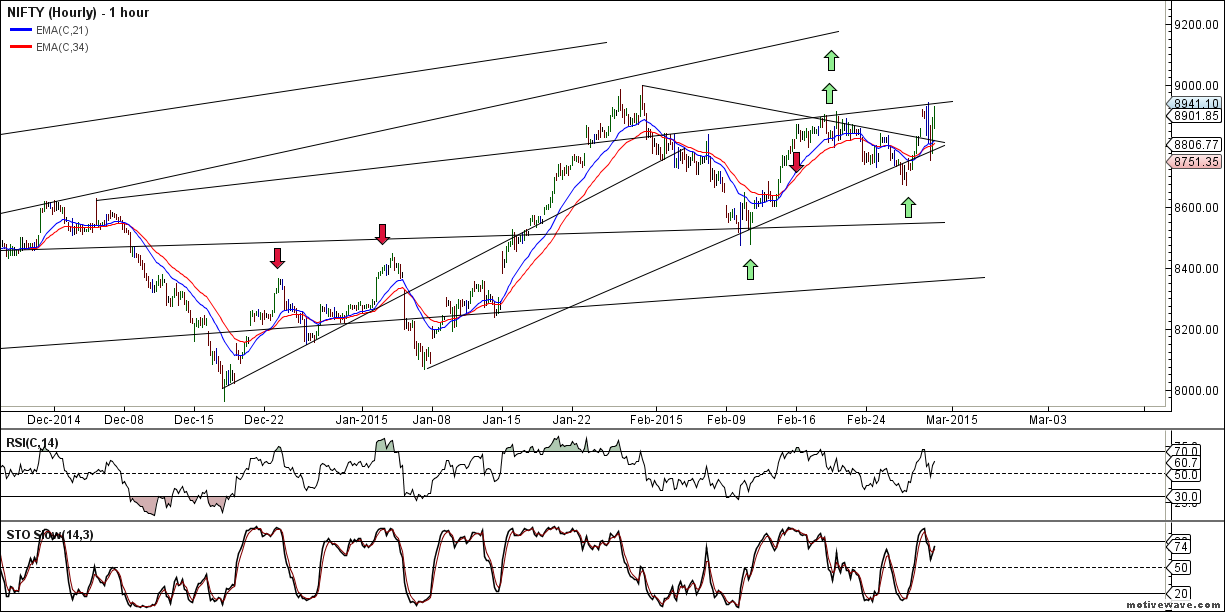
Nifty Hourly charts near its trendline resistance.
Nifty Hourly Elliot Wave Chart
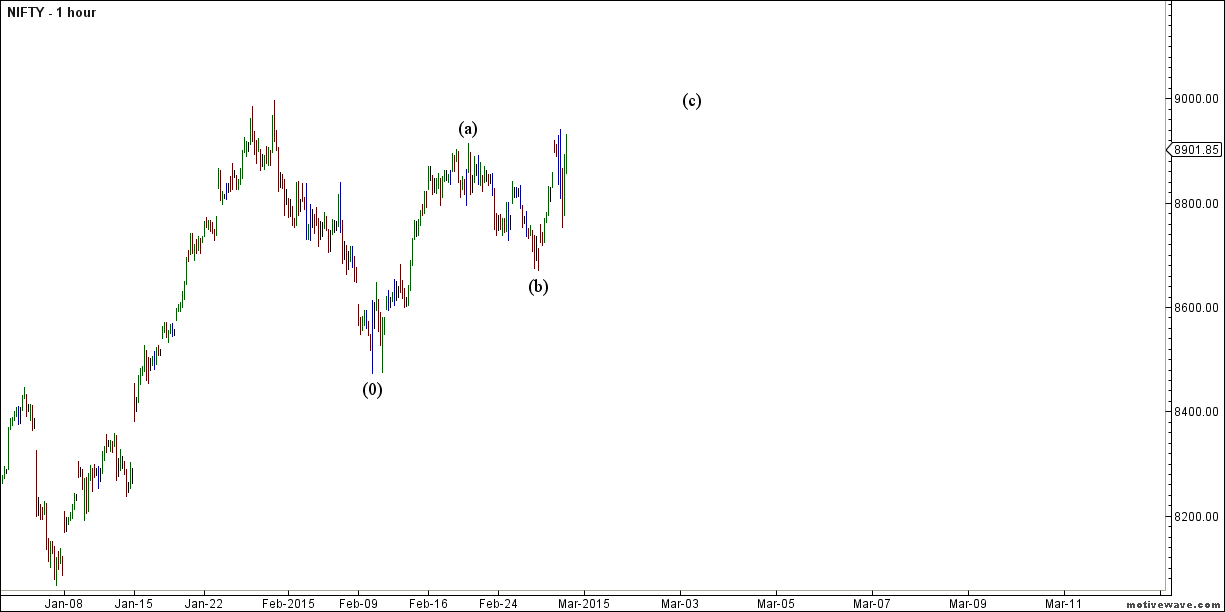
Elliot wave chart on Hourly is shown above suggesting 8806 will play a crucial role in coming week.
Nifty Gann Box
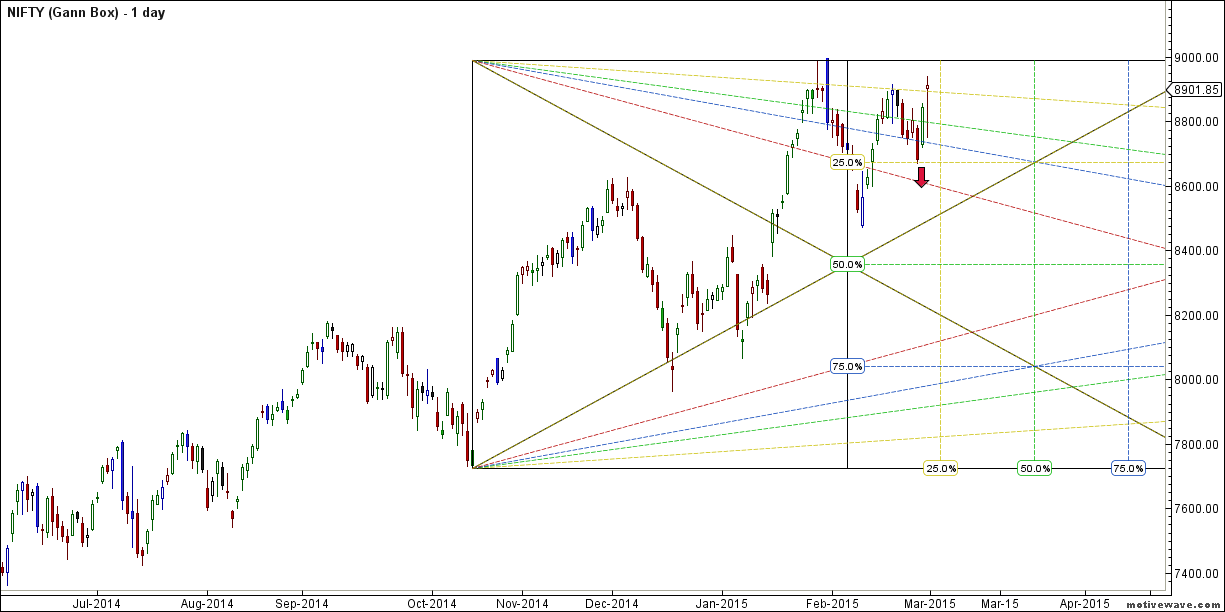
Closed above the Yeallow line and now crossing of 8996 will lead to breakout on upside and break of green line can see 8700/8650 on downside.
Nifty Daily Elliot Wave Chart
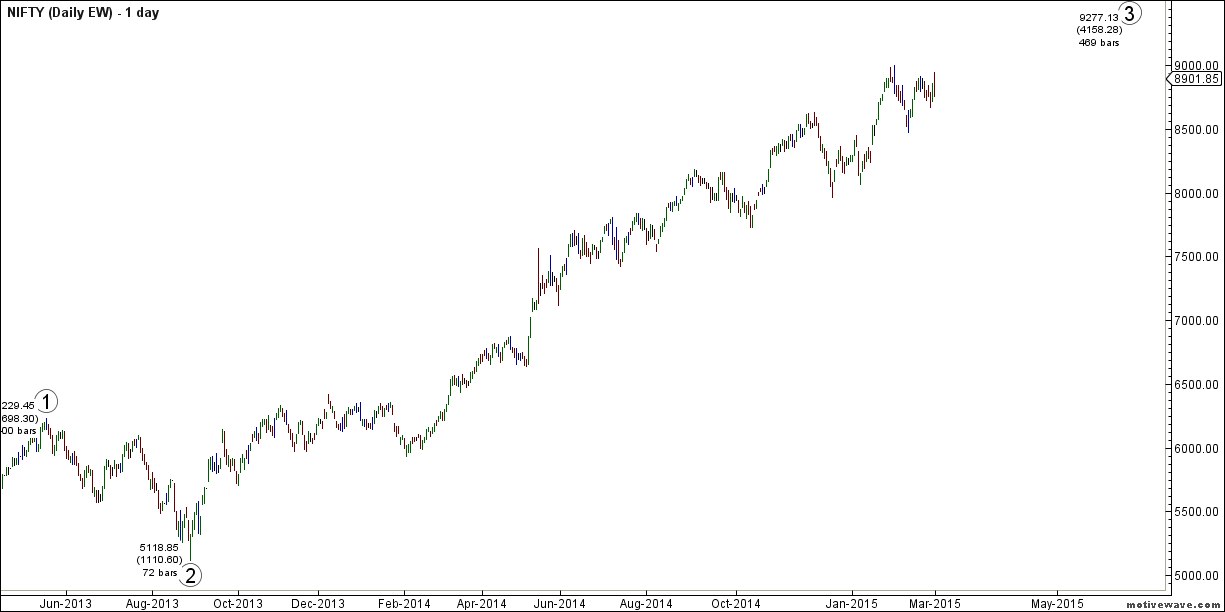
As discussed in last week analysis As per EW more legs are left to the rally use dips around 8300/8400 to take exposure to quality large and mid caps stocks. Market gave the expected dip 2 weeks before and we saw swift recovery, hopefully traders and investors got oppurtunity to take exposure to stocks.
Nifty Gann Date
Nifty As per time analysis 04 March is Gann Turn date , except a impulsive around this dates. Last week we gave 28 Feb/24 Feb Day and Nifty saw a volatile move on both the days .
Nifty Gann Emblem
Nifty did not reacted to Gann Emblem date on 16 Feb last week went very neutral so can see big move in coming week.
Nifty Gaps
For Nifty traders who follow gap trading there are 7 trade gaps in the range of 7000-7800
- 7067-7014
- 7130-7121
- 7276-7293
- 7229-7239
- 7454-7459
- 7526-7532
- 7598-7568
- 7625-7654
- 7780-7856
- 7927-7974
- 8029-8065
- 8378-8327
- 8102-8167
- 8277-8380
- 8711-8729
Fibonacci technique
Fibonacci fan
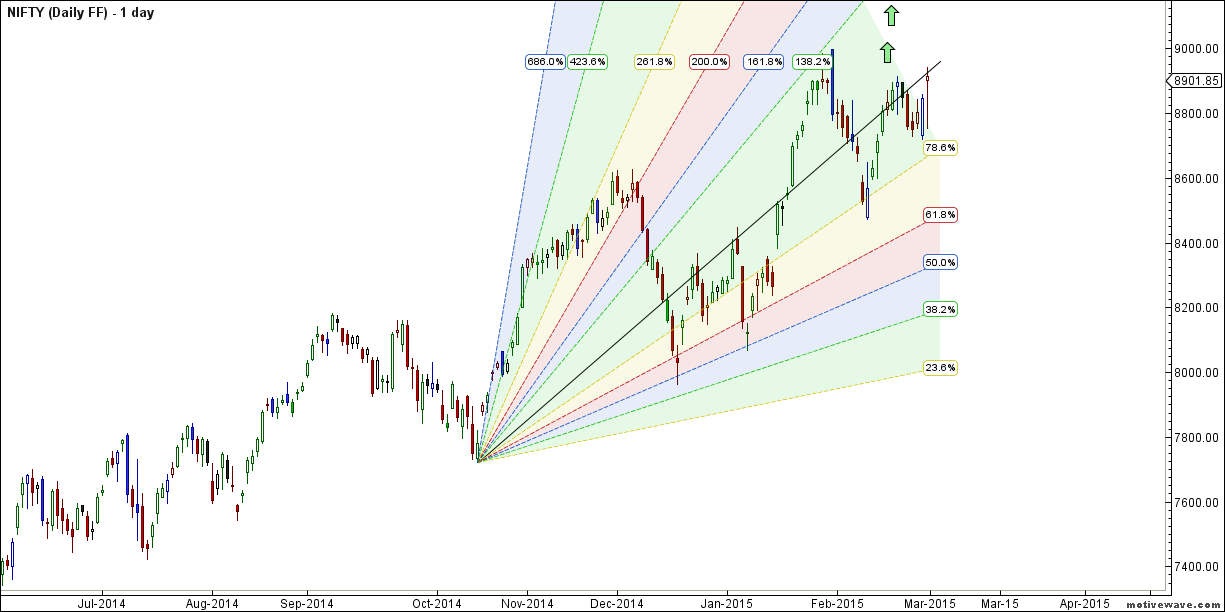
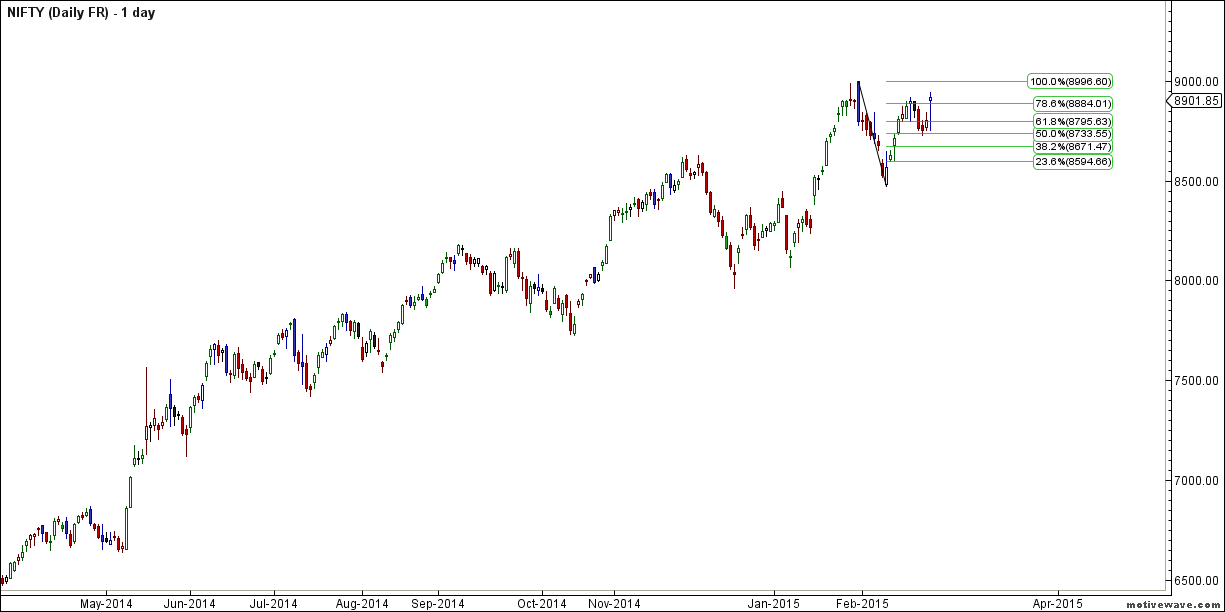
Nifty took exact support @ gann fan and is now going towards resistance line of FF As per Fibo retracement theory Nifty broke at 78.6% retracement @ 8884 and break above 8884 can see move towards 9000.
Nifty Weekly Chart
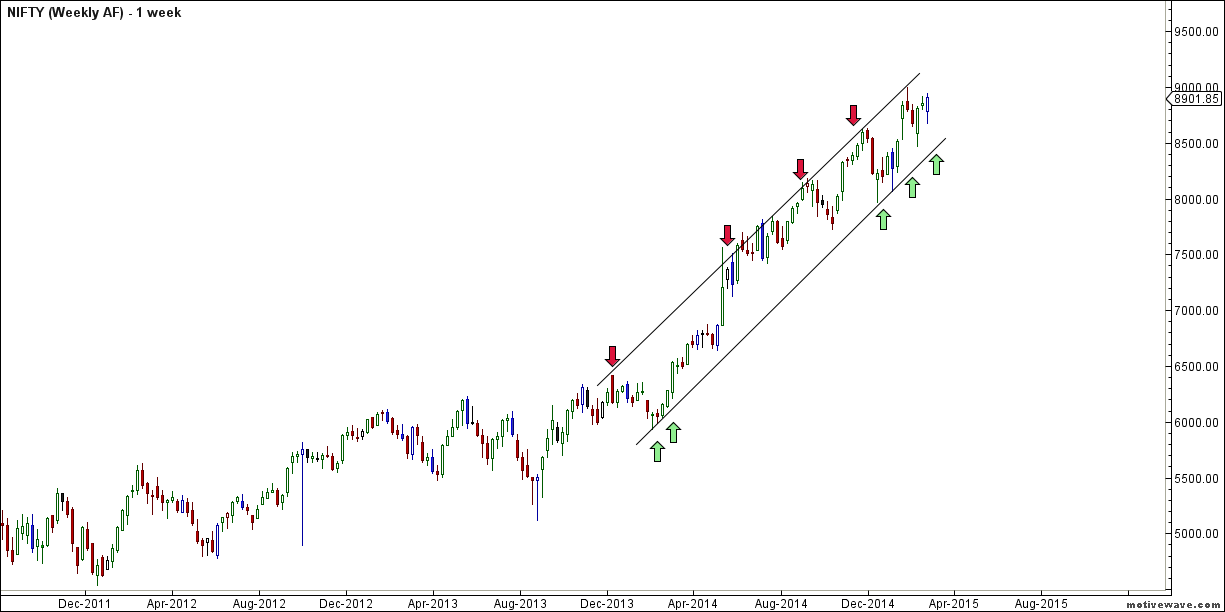
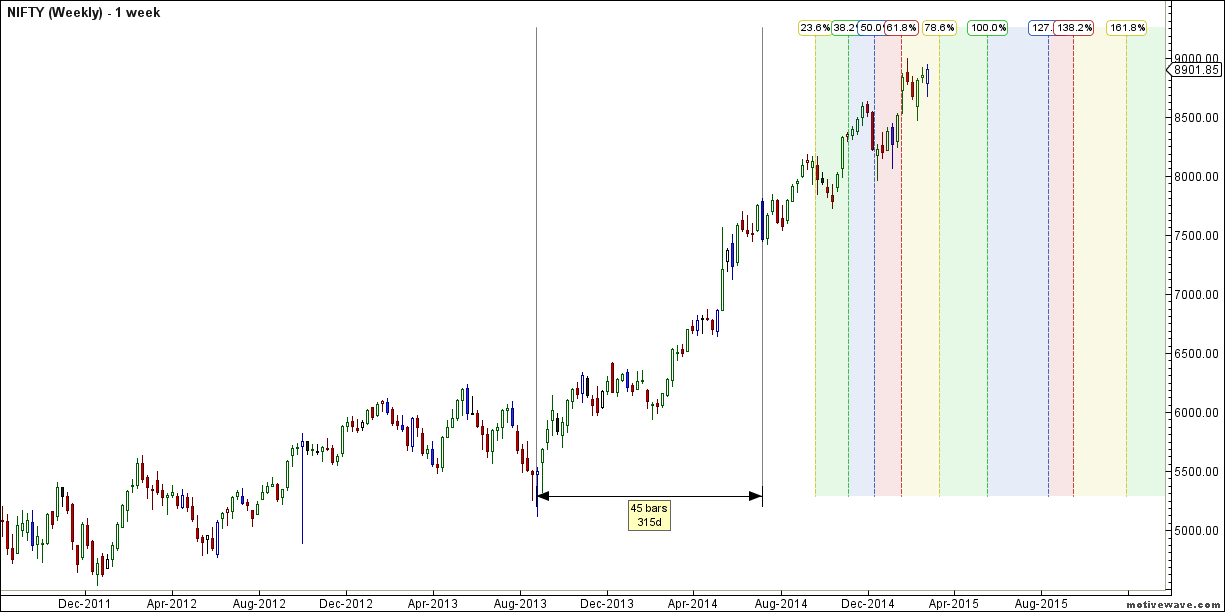
It was positive week, with the Nifty was up by 68 points closing @8901 forming a Harami candelstick pattern, holding above 8946 heading towards trendline resistance on weekly basis. As per time analysis next week we can see big move.
Trading Monthly charts
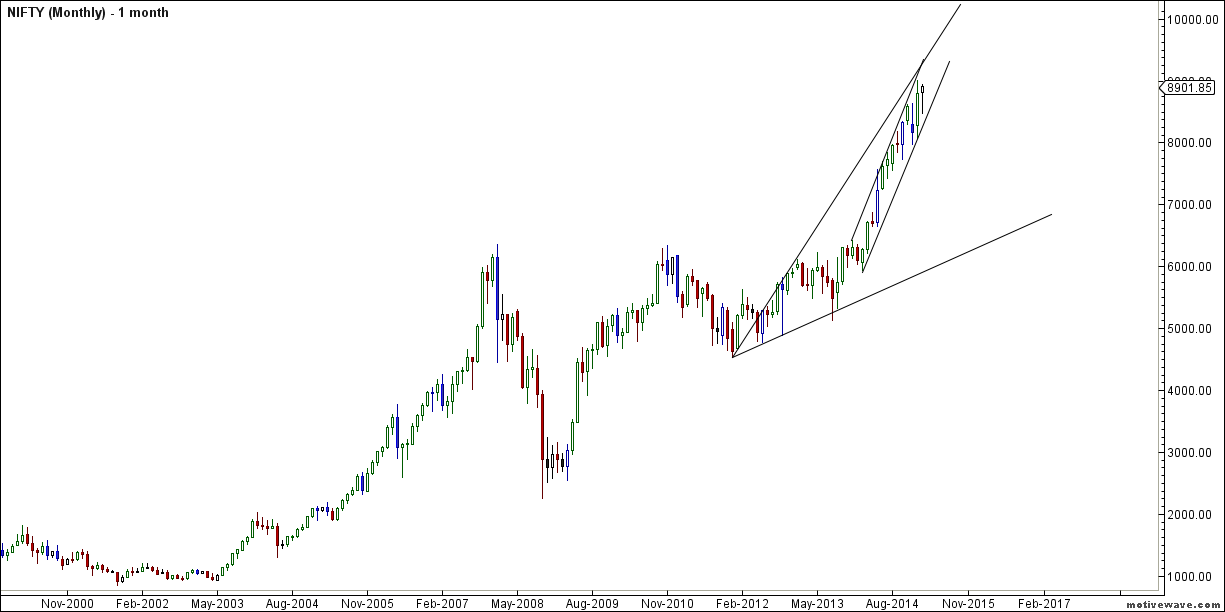
Nifty reacted from its lower trendline support of Monthly channel break of 8900 can see move towards 9200.
Nifty Weekly Chopad Levels
Nifty Trend Deciding Level:8936
Nifty Resistance:9066,9120,9200
Nifty Support:8865,8806,8750
Levels mentioned are Nifty Spot
Let me go by Disclaimer these are my personal views and trade taken on these observation should be traded with strict Sl.Please also read the detailed Disclaimer mentioned in the Right side of Blog.
Want to see post in your Inbox,Register by adding your email id in Post in your Inbox section
Follow on Facebook during Market Hours: https://www.facebook.com/pages/Brameshs-Tech/140117182685863


How to determine gaps…?
If there is a gap between:
1. Close of red candle and opening of red candle ?
2. Close of red candle and opening of green candle ? and vice versa…
Is it correct ?
Difference between close of previous day and open of current day
Sir.. how to determine on a Gann turn date on which side market will move
Excellent overall analysis. So glad to see someone who understands price, as well as time from an Elliott Wave perspective.
A question regarding your platform? Motive Wave??
Sir, you are mentioning big move…………..but up move or down move????????
“It was positive week, with the Nifty was up by 68 points closing @8901 forming a Harami candelstick pattern, holding above 8946 heading towards trendline resistance on weekly basis. As per time analysis next week we can see big move.”
For tht please follow chopad levels.
Positive above that negative below it