


Last week we gave Nifty Chopad level of 8107 and Nifty did 1 target on downside in choppy week of trading as weekly range was just 123 points, Lets analyze how to trade in coming week.
Nifty Hourly Chart

Nifty Hourly charts trading in channel and also seeing an convergence of 21/34 ema suggesting a range expansion will happen in coming week. Holding 8050 bounce back can be seen till 8200/8240,Break of 8050 will see a pullback till 7950.
Nifty Hourly Elliot Wave Chart

Hourly EW is showing if 8128 is not crossed correction tilll 7984.
Nifty Daily Chart

Nifty daily chart bias has turned from bullish to neutral so expect some range bound move in nifty in coming week.
Nifty Daily Elliot Wave Chart

Daily chart are is showing 3 wave completion around 8180 and pullback can be seen as part of 4 wave till 7950/7800 in coming week before next round of upmove.
Nifty Gann Date

As per time analysis 16 Sep +-1 day Big move can be seen in Nifty.
Nifty Gaps
For Nifty traders who follow gap trading there are 7 trade gaps in the range of 7000-7800
- 7067-7014
- 7130-7121
- 7276-7293
- 7229-7239
- 7454-7459
- 7526-7532
- 7598-7568
- 7625-7654
- 7874-7881
- 7904-7916
- 7954-7984
- 8027-8036
Fibonacci technique
Fibonacci fan

7950-7984 needs to be closely watched as per gann fan.
Nifty Gann Circle

Nifty is approaching the another gann circle support so next week is very crucial break below that 7977 can be seen.
Nifty Fibonacci Retracement

8027 /7977 are 2 Fibo retracement levels which needs to be watched closely.
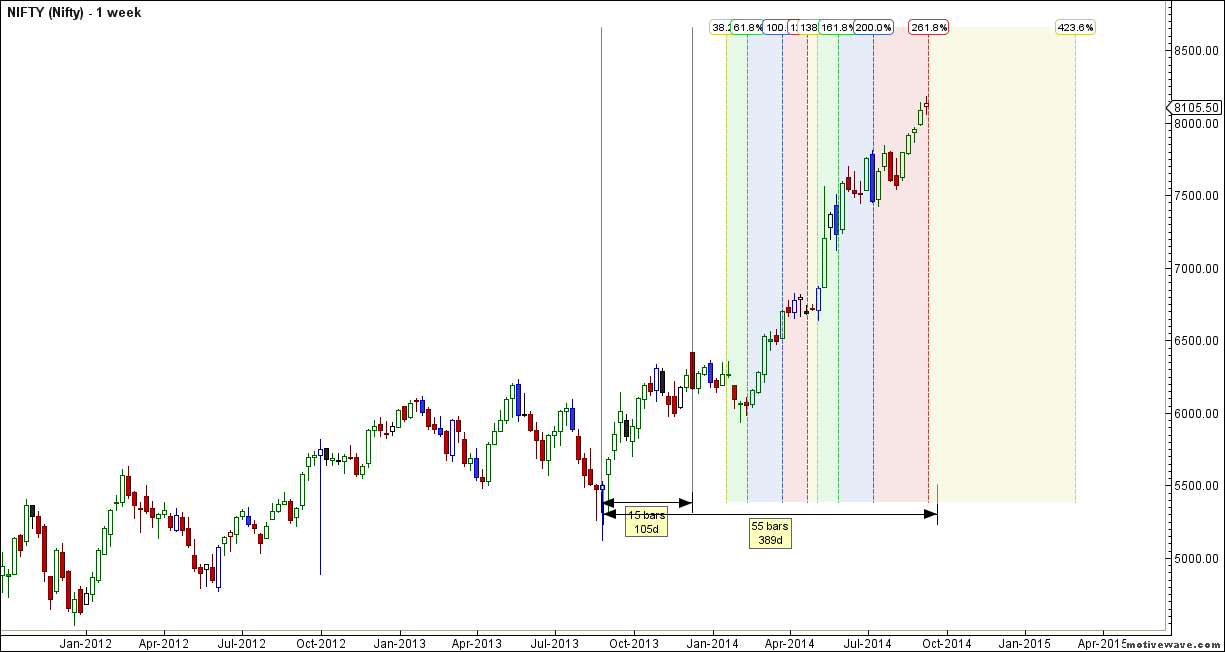
Nifty Weekly Chart

It was positive week, with the Nifty up by 18 points closing @8105 forming a DOJI candle pattern. Nifty took exact support near Andrew Pitchfork support line and now need to see will be see a pullback or next round of upmove. Negative divergence have started coming on weekly charts, break of 7950 can see the divergence come in effect.Also we are approaching the 55 day cycle on Weekly charts also.Weekly time analysis suggests next cycle to start soon.
Trading Monthly charts

Bulls will have to save 7950 for momentum to build in September Month.
Nifty Weekly Chopad Levels
Nifty Trend Deciding Level:8114
Nifty Resistance:8171,8237,8300
Nifty Support:8050,7992, 7930
Levels mentioned are Nifty Spot
Let me go by Disclaimer these are my personal views and trade taken on these observation should be traded with strict Sl
Want to see post in your Inbox,Register by adding your email id in Post in your Inbox section
Follow on Facebook during Market Hours: https://www.facebook.com/pages/Brameshs-Tech/140117182685863
hi, in above nifty gann date chart you have taken 8 aug as a initiating date, what is the condition or criteria while selecting a base date?
Please explain gann date and how to study the chart with the headings and bottom line given by you
This date is where market can shown big moves.
Rgds,
Bramesh
u beauty about nifty trade, u said if nifty does not hold 8050 then 7950 is on cards same thing happen
Thanks !!
Rgds,
Bramesh
Hi Bramesh,
In “Gann Date” section, you have given two statements on the top row and bottom of Gann Dates Table like “Strongest Zone – Expect Raise of 200-300 points in a single day” and
“Mixed Trends/Positional Opportunities end end of this period”. Here What is the meaning for period here ?
I understand later part as an opportunity that comes after Gann Big Move Date ? Am I correct ? In this post you have given the date as +/- 16th September.. Means after 16th September, market may be good to take position. or may be in sideways till next Gann Big Move Date. Is this correct ?
I understood first part one as Gann Date itself, where one can expect 200-300 points on a single day ?
All dates highlighted with blue color are Strong Move dates ? Is it correct ?
As per Gann, we need to see for a date which is falls inbetween Ordinal/diagonals am I correct ?
I am correct ?
Yours understanding is correct..
Rgds,
Bramesh
friday pattern is of bullish harami which is of reversal in nature
Exelent