Axis Bank
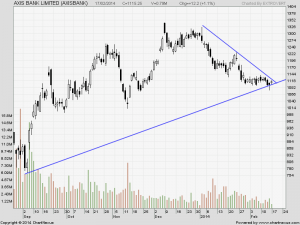
Buy above 1120 TGt 1128,1136 and 1149 SL 1113
Sell below 1112 Tgt 1107,1098 and 1092 SL 1116
Canara Bank
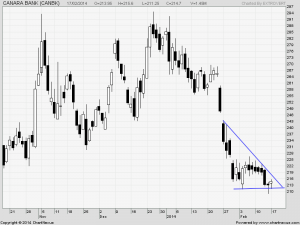
Holding 212 on closing basis,Stock could head for 220,225 in short term.
Buy above 215 Tgt 216.4,218.2 and 220.5 SL 213.5
Sell below 213.2 Tgt 212,209.5 and 207.7 SL 214
Tata Steel
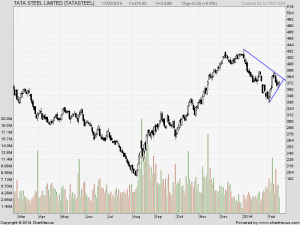
 Positional traders should look for close above 377 for short term target of 385,390
Buy above 375 Tgt 377.2,380.5 and 385 SL 373.5
Sell below 371 Tgt 369,366 and 363 SL 373.5
Performance sheet for Intraday and Positional is updated for February
http://tradingsystemperformance.blogspot.in/
http://positionalcallsperformance.blogspot.in/
- All prices relate to the NSE Spot
- Calls are based on the previous trading day’s price activity.
- The call is valid for the next trading session only unless otherwise mentioned.
- Stop-loss levels are given so that there is a level below/above, which the market will tell us that the call has gone wrong. Stop-loss is an essential risk control mechanism; it should always be there.
- Book, at least, part profits when the prices reach their targets; if you continue to hold on to positions then use trailing stops to lock in your profits.


Dear Brahmeshji, We can say that It Was Great Spotting Everytime You Post Scripts For Buy or Sell.I Know That It is Free Guidence Provided by You To Retail And Small trader.It comes After Your Hard Work and Lot Of Experiance. Thanks A Lot FOr All Help To Trader Community.
Thanks a lot Uttamji..
Rgds,
Bramesh